Where porosity is the major parameter that influences static volumes, permeability is the main parameter with respect to dynamic performance. Permeability can be measured at different scales, ranging from well tests to core plug measurements. Because of the different scales, the results can sometimes disagree and obtaining a sufficiently large dataset to confidently understand the relationship between porosity and permeability is usually an expensive undertaking.
Fundamental Permeability Principles
In the absence of extensive porosity-permeability measurements, an alternative approach to predict permeability from the rock character and porosity is required. Many models have been proposed to model permeability, both empirical and theoretical. One of the well-known fundamental correlations is the Kozeny equation which is derived by combining Poiseuille’s equation with Darcy’s law and solving for permeability.
Where:
k = Permeability, millidarcy
φ = Rock porosity, fraction
τ = Tortuosity, dimensionless
r = Radius of capillary tubes, μm
The relationship reveals that permeability is a function of the rock porosity, tortuosity and the capillary tube radii. This drives three fundamental principles of permeability:
- The greater the pore volume in a rock, the higher the permeability. For a given lithology, an increase in porosity corresponds to an increase in permeability.
- Complex (poorly sorted sandstones or highly heterogeneous carbonates) lithologies have a higher permeability that arises from the tortuous flow paths that the fluid must follow.
- The narrowest points through which fluid must flow (pore throats) have a strong influence on permeability.
Modelled Permeability
The cementation exponent, being an electrically determined parameter, can be related to the flow path of electrical current through the more conductive water in the formation pore space. In this respect there is a physically similar basis between the cementation exponent and tortuosity. Since tortuosity is related to permeability through the theoretically derived Kozeny equation, it is reasonable to expect that there should also exist a relationship between the cementation exponent and permeability.
Nooruddin and Hossain (2011) proposed a modification to improve the handling of the tortuosity term based on the relationship between tortuosity, formation resistivity factor and cementation exponent that was derived from theoretical approaches by Wyllie and Rose (1950). The new tortuosity term was validated using the dataset and substitution of the term into the permeability model proposed by Hagiwara (1986). This model can be shown to have a similar form to Kozeny’s equation. By regressing the revised model against Hagiwara’s dataset, Nooruddin and Hossain obtained the following equation:
Where:
k = Permeability, millidarcy
φ = Rock porosity, fraction
m = Cementation exponent
rt = Average pore throat radius, μm
This is effectively the Kozeny model reformulated to use cementation exponent instead of the theoretical tortuosity and pore throat sizes instead of capillary tube radii. As such it should be more applicable to real-world reservoir formations rather than just synthetic porous media.
In our simplistic rock model, we define the cementation exponent and the average pore body radius. To determine the average pore throat radius we must therefore first establish the pore geometry (rb/rt) and use this to calculate the pore throat size. The pore geometry can be derived from the cementation exponent and the porosity. To simplify matters further, we will assume a fixed porosity of 20% when determining the pore geometry from the cementation exponent.
This means that the applied model for permeability is a function of porosity, cementation exponent (akin to tortuosity) and pore throat size (derived from pore body size and cementation exponent). All three values have been shown by extensive research to be important drivers of permeability. By choosing appropriate cementation exponent and pore body size values to characterise the reservoir rock, it is possible to model any porosity-permeability relationship in a manner that is consistent with the physical assumptions. In other words, rather than just using a mathematical correlation based on a linear regression to measured datapoints, the porosity-permeability transform is based on the physical properties of the rock.
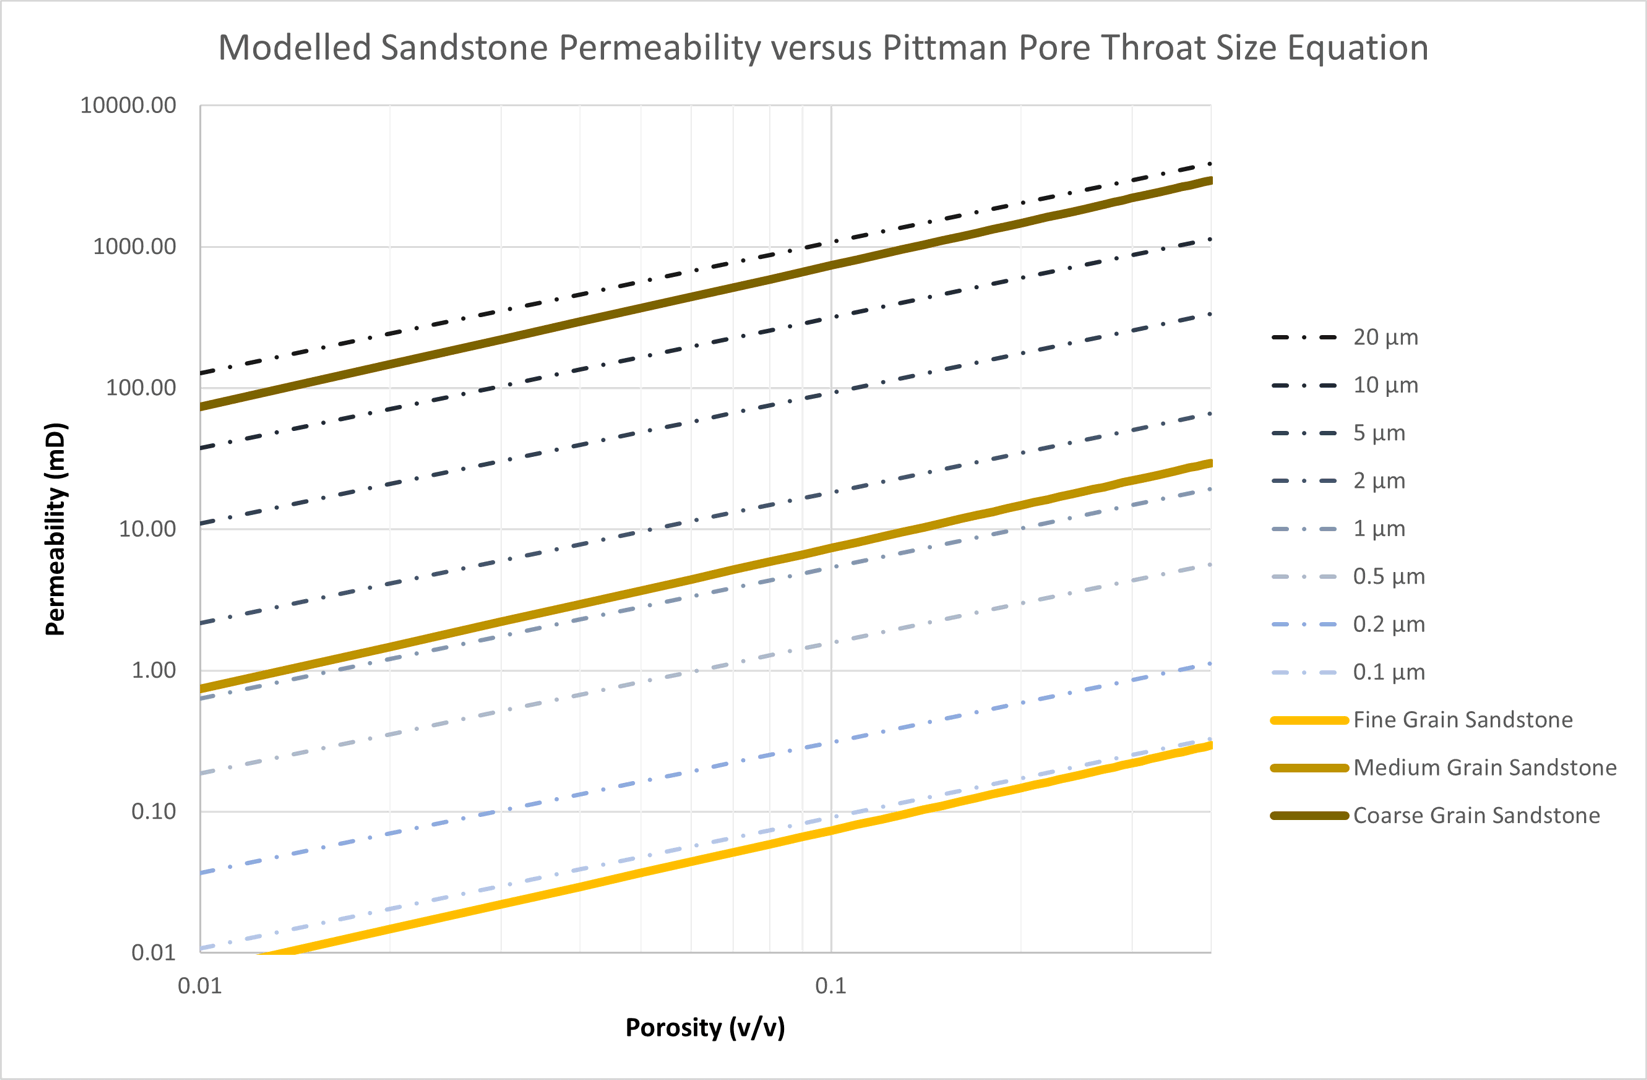
The capability of the chosen model to effectively model a variety of porosity-permeability transforms is tested. For sandstones the Pittman model suggests that permeability is a function of pore throat size. These relationships could be closely replicated using a cementation exponent of 1.0, and pore throat sizes of 0.1 μm (fine grain), 1 μm (medium grain) and 10 μm (coarse grain) pore throat sizes. Whilst the correlations do not match exactly, they are reasonably close. Use of a cementation exponent in the range 1.8 to 2.0 should therefore lead to a reasonable predictive performance for sandstones.
Lucia observed that carbonate permeabilities did not match those predicted by the Pittman equation. Instead, relationships were developed for different classes of carbonate. Using Lucia’s generalised permeability equation based on the rock fabric number, a series of porosity-permeability transforms can be generated.
By adjusting the cementation exponent and average pore body radius, it is possible to create curves using the modified Hagiwara permeability equation that fit these transforms.
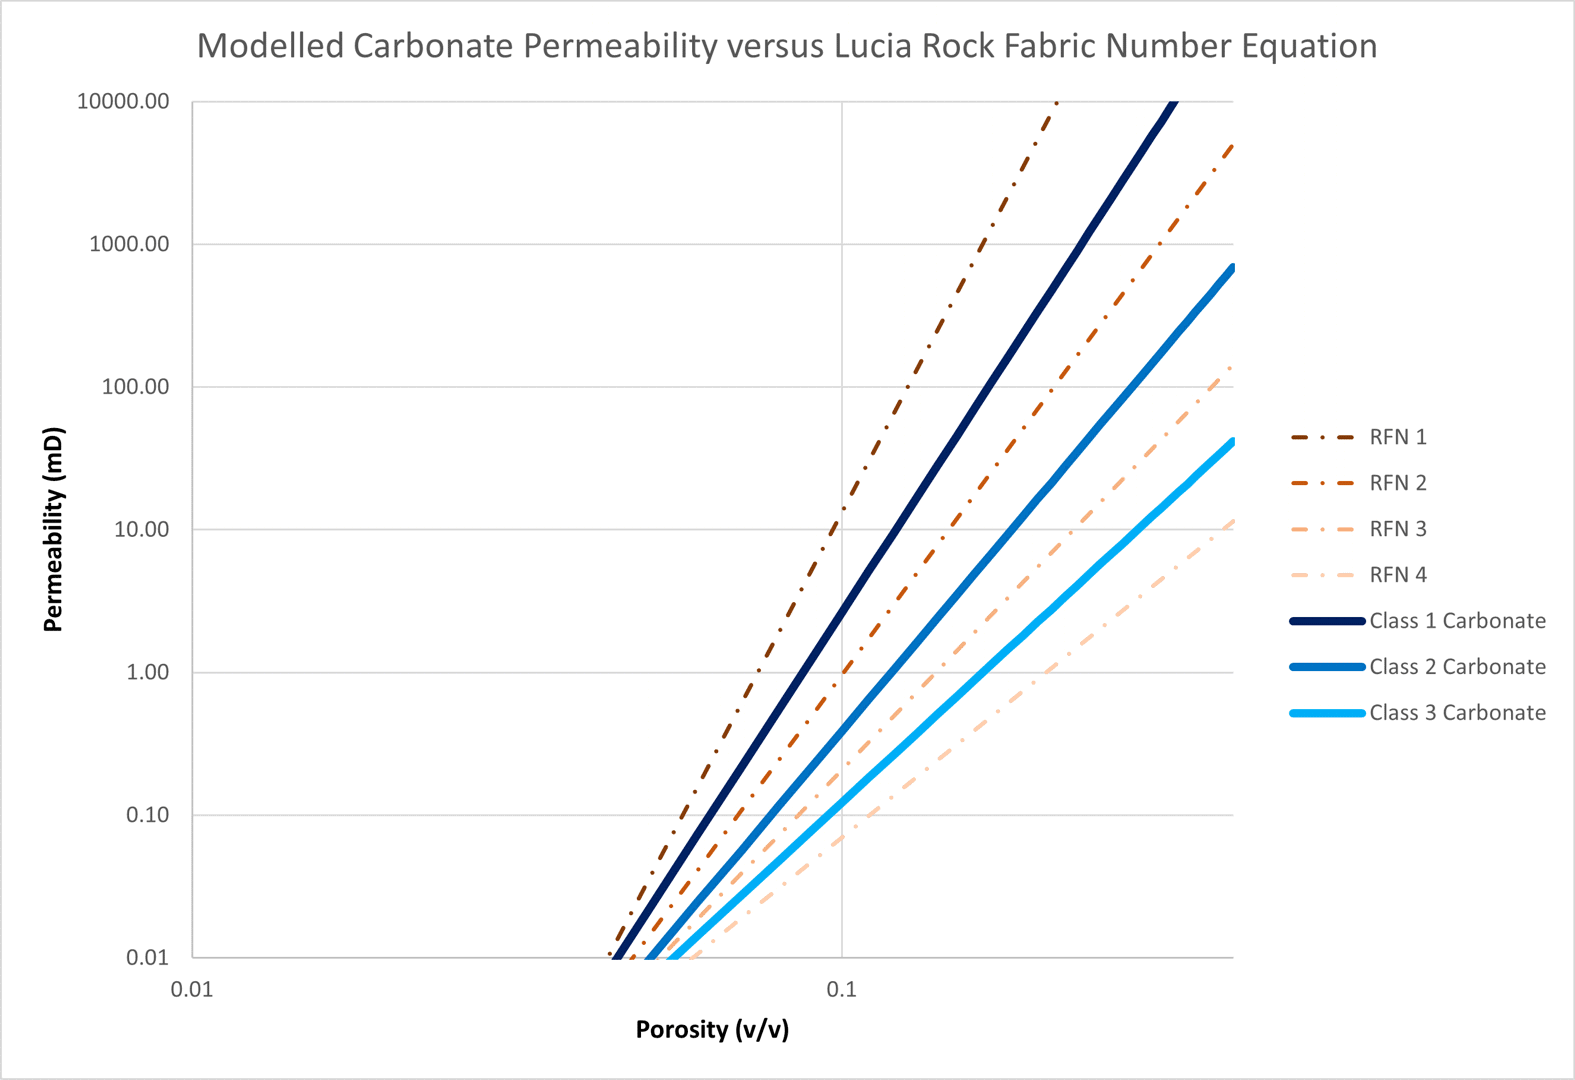
The result for Class 1 carbonate was achieved with m = 4 and rb = 60 mm. The result for Class 2 carbonate was achieved with m = 3.2 and rb = 1.6 mm. The result for Class 3 carbonate was achieved with m = 2.6 and rb = 0.11 mm. These parameters are consistent with a transition from grain-dominated fabric in Class 1 through to mud-dominated fabric with smaller pore throat sizes in Class 3.
The applied permeability model can therefore be used to generate porosity-permeability transforms for both sandstones and carbonates using the simplified rock characteristic model.
Validation of Permeability Model
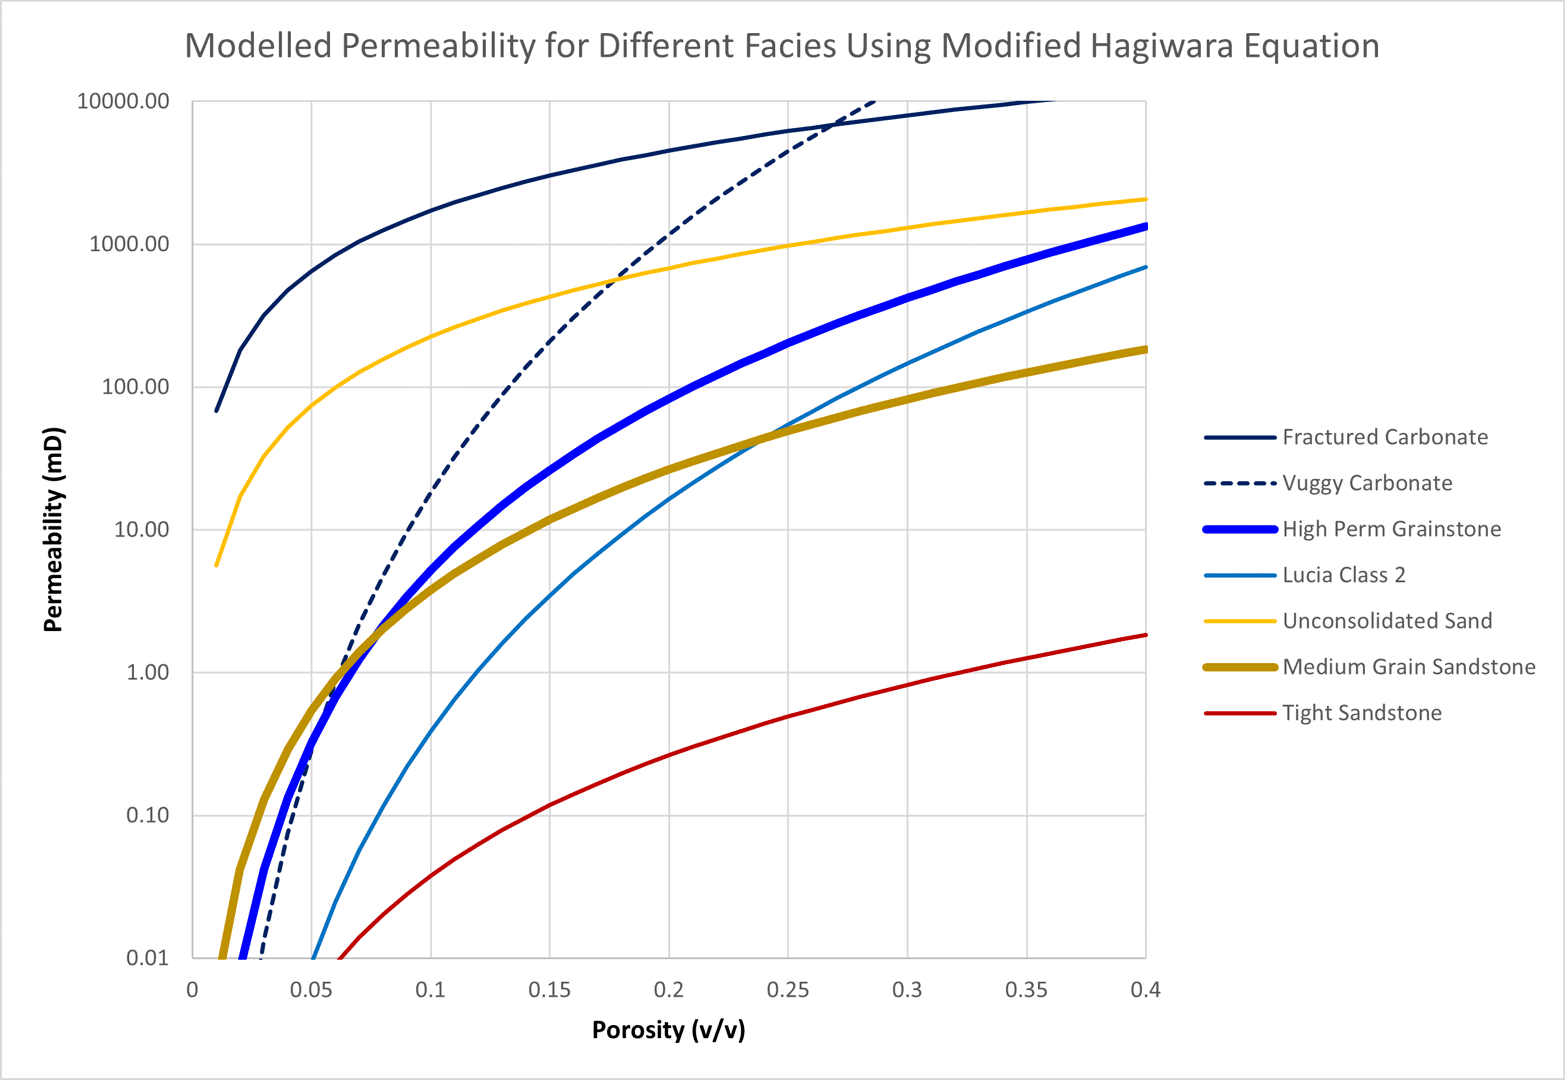
To demonstrate the generality of the approach a variety of different sandstone and carbonate rock fabrics have been tested. The resulting porosity-permeability transforms are plotted to check that the values produced are reasonable and cover the expected range of values.
| Lithology | Rock Characterisation | m | rb (mm) |
|---|---|---|---|
| Fractured Carbonate | Carbonate dominated by high flow pathways created either from fracturing or karstification. Rock has a low cementation exponent and associated small rb/rt pore geometry as pore throats are similarly sized to the pores and do not represent a major restriction to flow. The modelled rock character has small fractures with a small rb. Larger karstified pores results in multi-Darcy scale permeability. | 1.2 | 0.1 |
| Vuggy Carbonate | Highly variable carbonate with many different pore size from small pores arising from dolomitization through to large touching vugs. Flow pathways can be highly tortuous with large contrast between rb and rt, hence high cementation exponent and centimetre-scale average pore body size. | 3.5 | 30 |
| High Perm Grainstone | Highly dolomitized grainstone typical of a lagoonal reef carbonate sand. | 2.5 | 0.5 |
| Lucia Class 2 | Parameters used to match Lucia Class 2 carbonate porosity-permeability relationship. | 3.2 | 1.6 |
| Unconsolidated Sand | Typical cementation exponent for unconsolidated sand with less tortuous pathways due to unconsolidated nature of the formation. Pore body size chosen leads to an associated average pore throat radius of ~10 μm. | 1.3 | 0.05 |
| Medium Grain Sandstone | Typical cementation exponent for sandstones lies in the range 1.8 to 2.0. Pore body size is same as for unconsolidated sand to illustrate the effect of cementation exponent on the predicted permeabilities. | 1.9 | 0.05 |
| Tight Sandstone | Cementation exponent is same as for medium grain sandstone to illustrate the effect of pore body size on the predicted permeabilities. Fine grain pore body size chosen leads to an associated average pore throat radius of ~0.5 μm. | 1.9 | 0.005 |
The permeabilities generated using these input parameters cover a range that is several orders of magnitude. The permeabilities are consistent with what would be expected for each modelled rock type e.g., the tight sandstone permeabilities are typically less than 1 mD whereas the fractured carbonate exhibits multi-Darcy permeability.
The benefit of this porosity-permeability methodology is that it has a theoretical basis that is adapted to utilise readily estimated parameters for rock characterisation. In the absence of porosity-permeability measurements to calibrate a correlation, this allows a reasonable relationship to be determined from the fundamental geological description of the rock. When measurements do become available the relationship can easily be updated to honour the datapoints.
Another benefit of this approach is that it allows static models to better capture the heterogeneity inherent in permeability measurements. Usually, static models will have a variable porosity, and the associated permeability is derived from a porosity-permeability relationship that is a function of porosity alone. Hence a crossplot of the porosity versus permeability for each cell in a static model will produce a curved line that matches the equation used.
The approach outlined here allows a distribution to be applied to static model cells for not just porosity, but also the cementation exponent and pore body radius. Because permeability is a function of these three parameters, a crossplot of porosity versus permeability using this approach will produce a cloud of points that is a better reflection of the heterogeneity inherent in any reservoir.