Conventionally, rock that is of interest to reservoir engineers is a porous medium. This means that there is pore space that exists within the rock matrix, and that those pore spaces are connected to each other and can contain fluids including hydrocarbons and water.
There are a very large variety of rocks that are found throughout the world and no two rock formations are identical. This means that there are a myriad of ways to describe and measure the nature of rocks, all of which makes the life of a geologist most interesting and rewarding.
From the perspective of a reservoir engineer there are two aspects about rocks that we want to define and understand. These two aspects direct attention to the rock properties that we are most interest in defining:
- How much hydrocarbon is contained within the rock? The parameters related to the volumes of hydrocarbons within the rock are static properties. The two main variables of interest are porosity (the proportion of gross rock volume that comprises pore space) and hydrocarbon saturation (the proportion of that pore volume that contains hydrocarbons). Hydrocarbon saturation can also be defined as 1.0 – initial water saturation. For each of these parameters, there are secondary concepts that should also be considered. For porosity, the concept of effective porosity as opposed to total porosity needs to be determined and for saturation the variation of initial hydrocarbon saturation with porosity and height above the free water level, or saturation height function, must be calculated. The variation of saturations with height is related to capillary pressure forces that act on the fluid within the pore space.
- How much hydrocarbon can be recovered from the rock? The parameters related to the volumes of hydrocarbons within the rock are dynamic properties. With respect to the rock the key property is permeability, being a measure of how easily fluid can flow through the porous media. Permeability itself is related to the smallest openings that the fluid must pass through, which can be defined with knowledge of the pore geometry and the pore throat size. Since the flow path tortuosity also affects permeability thus must be considered. Since reservoirs usually contain at least two immiscible phases, the relative permeability that defines the preferential flow of one phase relative to the others must be defined in addition to the residual saturations for those phases in relation to the drainage and imbibition processes. These relative permeabilities are also affected by the wettability and miscibility of the fluids, so the interaction between the fluids and the rock must be understood.
Many of these properties can be measured from core samples in a laboratory or determined from electrical log measurements. Often the approach undertaken is to treat the measurements as a ground truth and empirically derive correlations from the data which can be used in a simulator to define the relationships between all the parameters. This is particularly the case with permeability and relative permeability where core measurements are used to define a porosity-permeability transform and relative permeability curves are fitted to actual core plug measurements. A different approach is proposed here. Building on the vast literature of research into porous media, a first principles approach is used to define the rock and from this derive a set of related properties. Where data are available the input parameters can be tuned so as to improve the match of modelled curves to the data. The key difference is that rather than starting with the data and using this to drive the relationships, physical principles and empirically tested observations are used to underpin modelled relationships based on assumptions about the rock fabric. Those assumptions are then tweaked to better match the relationships to any observed data.
Simplified Rock Model
The modelling philosophy used is to create a simple rock model which allows variability in the parameters used to describe the rock character to be incorporated into a static model. The rock model is used to generate other all other parameters in the reservoir model, including permeability, relative permeabilities, irreducible and residual saturations. The generated parameters can then be compared against measured data including core, logs and well tests to test the appropriateness of the rock models used. When building a static model variation in the rock character can be distributed across the cells in the model, and parameters used for static resource estimation or dynamic simulation can then be determined from the rock model in each cell. Because the parameters are always calculated using a physically consistent basis, the static and dynamic models should be better constrained to valid realisations.
This is a different approach to conventional petrophysics where logs, which are simply electrical measurements on rocks, are essentially inverted using classical equations to determine basic parameters such as porosity and water saturation. When building a static model, it is these parameters, as determined from log interpretation, that are distributed across the cells in the model. The model thus captures variability in parameters, not variability in rock. Because the parameters are just mathematically distributed, physically inconsistent combinations of parameters can inadvertently be used. This problem is exacerbated when the common application of porosity multipliers to a reservoir model is implemented. All other reservoir properties should be updated to reflect the change in porosity. Depending on how the relationships between properties were mathematically derived, the change in porosity may lead to the introduction of physically inconsistency between the adjusted parameters. This leads to realisations that are mathematically possible (and indeed the reservoir simulator will faithfully take these inputs and calculate the respective result) but would not be physically found in nature.
Cementation Exponent and Pore Geometry
Conventionally resistivity logs are used to determine water saturation (and hence hydrocarbon saturation) within a reservoir. Fundamentally, this assumes that the reservoir contains hydrocarbons at close to initial saturation conditions.
Consider Archie’s equation (Archie, 1942):
Where:
Rt = Total resistivity measured by log, Ω∙m
Rw = Water resistivity, Ω∙m
φ = Rock porosity, fraction
Sw = Water saturation, fraction
a = Tortuosity constant
m = Cementation exponent
n = Saturation exponent
For carbonates a common approach is to assume a = 1 and m = n = 2, although it has long been recognised that the cementation exponent is related to pore geometry and varies in most carbonates with cementation exponents greater than 2 for vuggy rock. Through combination of the resistivity measurements and a determination of porosity, use of fixed Archie’s constants allows the unknown water saturation to be solved.
It has long been recognised that the value of the ‘m’ exponent in Archie’s equation (2) is physically related to the nature of the rock fabric. Archie noted a difference between unconsolidated sands which exhibit an ‘m’ exponent of approximately 1.3 and consolidated sands where the exponent ranges from 1.8 to 2.0 (Archie, 1942). The observation that as a formation becomes more consolidated and the pore throat sizes are reduced led to the adoption of the terminology ‘cementation exponent’. This is intuitive since an increasing degree of cementation within a consolidated sandstone will lead to a reduction in pore throat size.
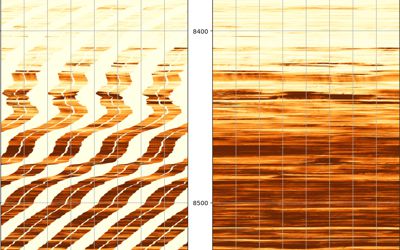
In a carbonate, cementation can be conceptualised as the pore throat sizes relative to the pore spaces. In a vuggy carbonate, large pore spaces are connected by narrow pore throats which is analogous to a more cemented rock fabric and hence a higher ‘m’ exponent. In a fractured carbonate the opposite applies. The fracture porosity is small in comparison to what appear to be near-infinite pore throat sizes which leads to ‘m’ exponents that approach a value of 1.0.
The basic relationship between the cementation exponent, pore geometry and fluid paths is illustrated below:
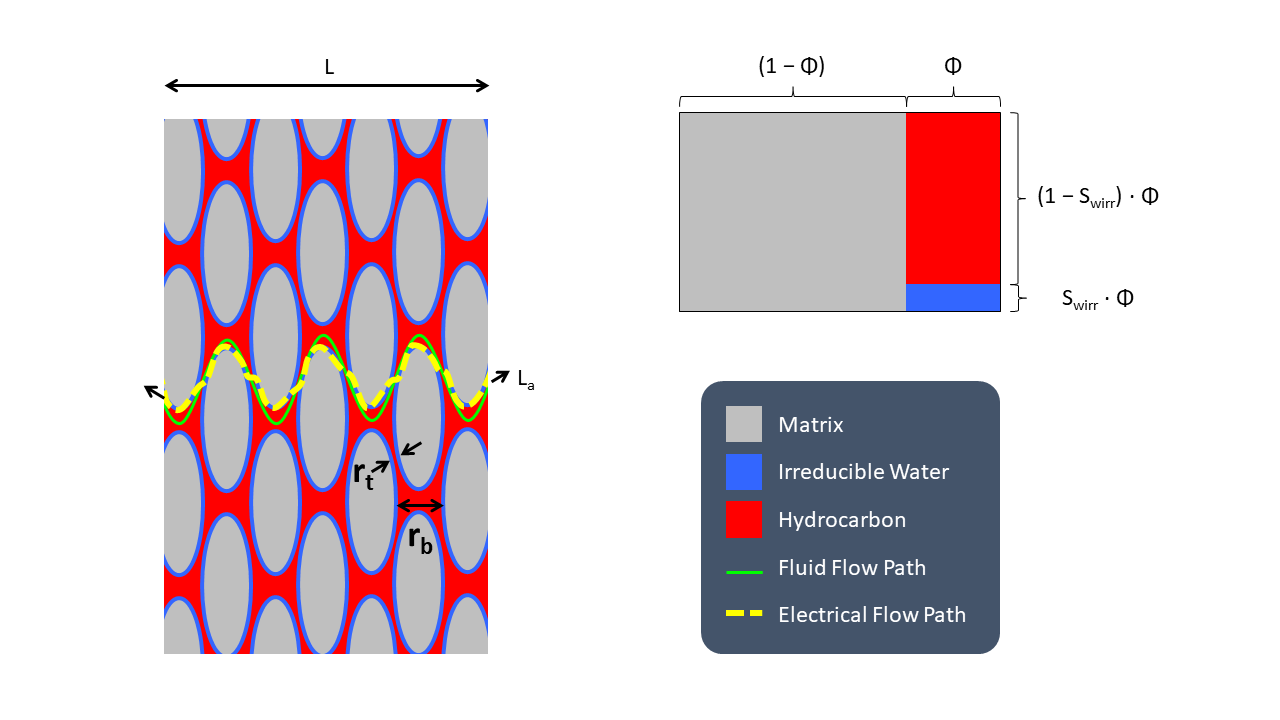
Our simplified rock model comprises three components. These are the rock matrix (which can include both dry clay and clay bound water), and a mixture of water and hydrocarbon which occupies the effective porosity space. The heterogeneous nature of the real rock is reduced to an idealised porous medium of identical matrix particles sized such that the porosity is the same as the average porosity for the real rock. The narrowest distance between rock matrix particles is the pore throat size (rt) and the average distance between rock matrix particles is the pore body size (rb).
In a water-wet rock, the irreducible water is bound to the surface of the rock matrix. As water is more conductive than hydrocarbon or rock, the electrical flow path follows the water around the matrix particles, crossing between rock particles at the pore throats. This is very similar to the fluid flow path which must also navigate around the rock particles via the pore throats. The electrical flow path is related to the cementation exponent ‘m’, which in turn is similar to the actual fluid flow path of length (La) for a rock of size L. This allows tortuosity to be defined as:
Longer flow paths correspond to an increase in cementation exponent, along with an increase in the ratio between rb and rt. This means that there is a relationship between the cementation exponent and the pore geometry, and therefore it is only necessary to define one of rb and rt if the tortuosity is defined, since the ratio rb/rt will depend on the tortuosity.
To mathematically relate cementation exponent to the pore geometry a theoretical pore channel model was constructed by (Müller-Huber, Schön, & Börner, 2015) which includes a variable pore radius. This is a modification to the simple capillary tube model. The pore throat radius is defined as rt at the narrow end of the channel and this radius increases to a radius of rb at the pore body.
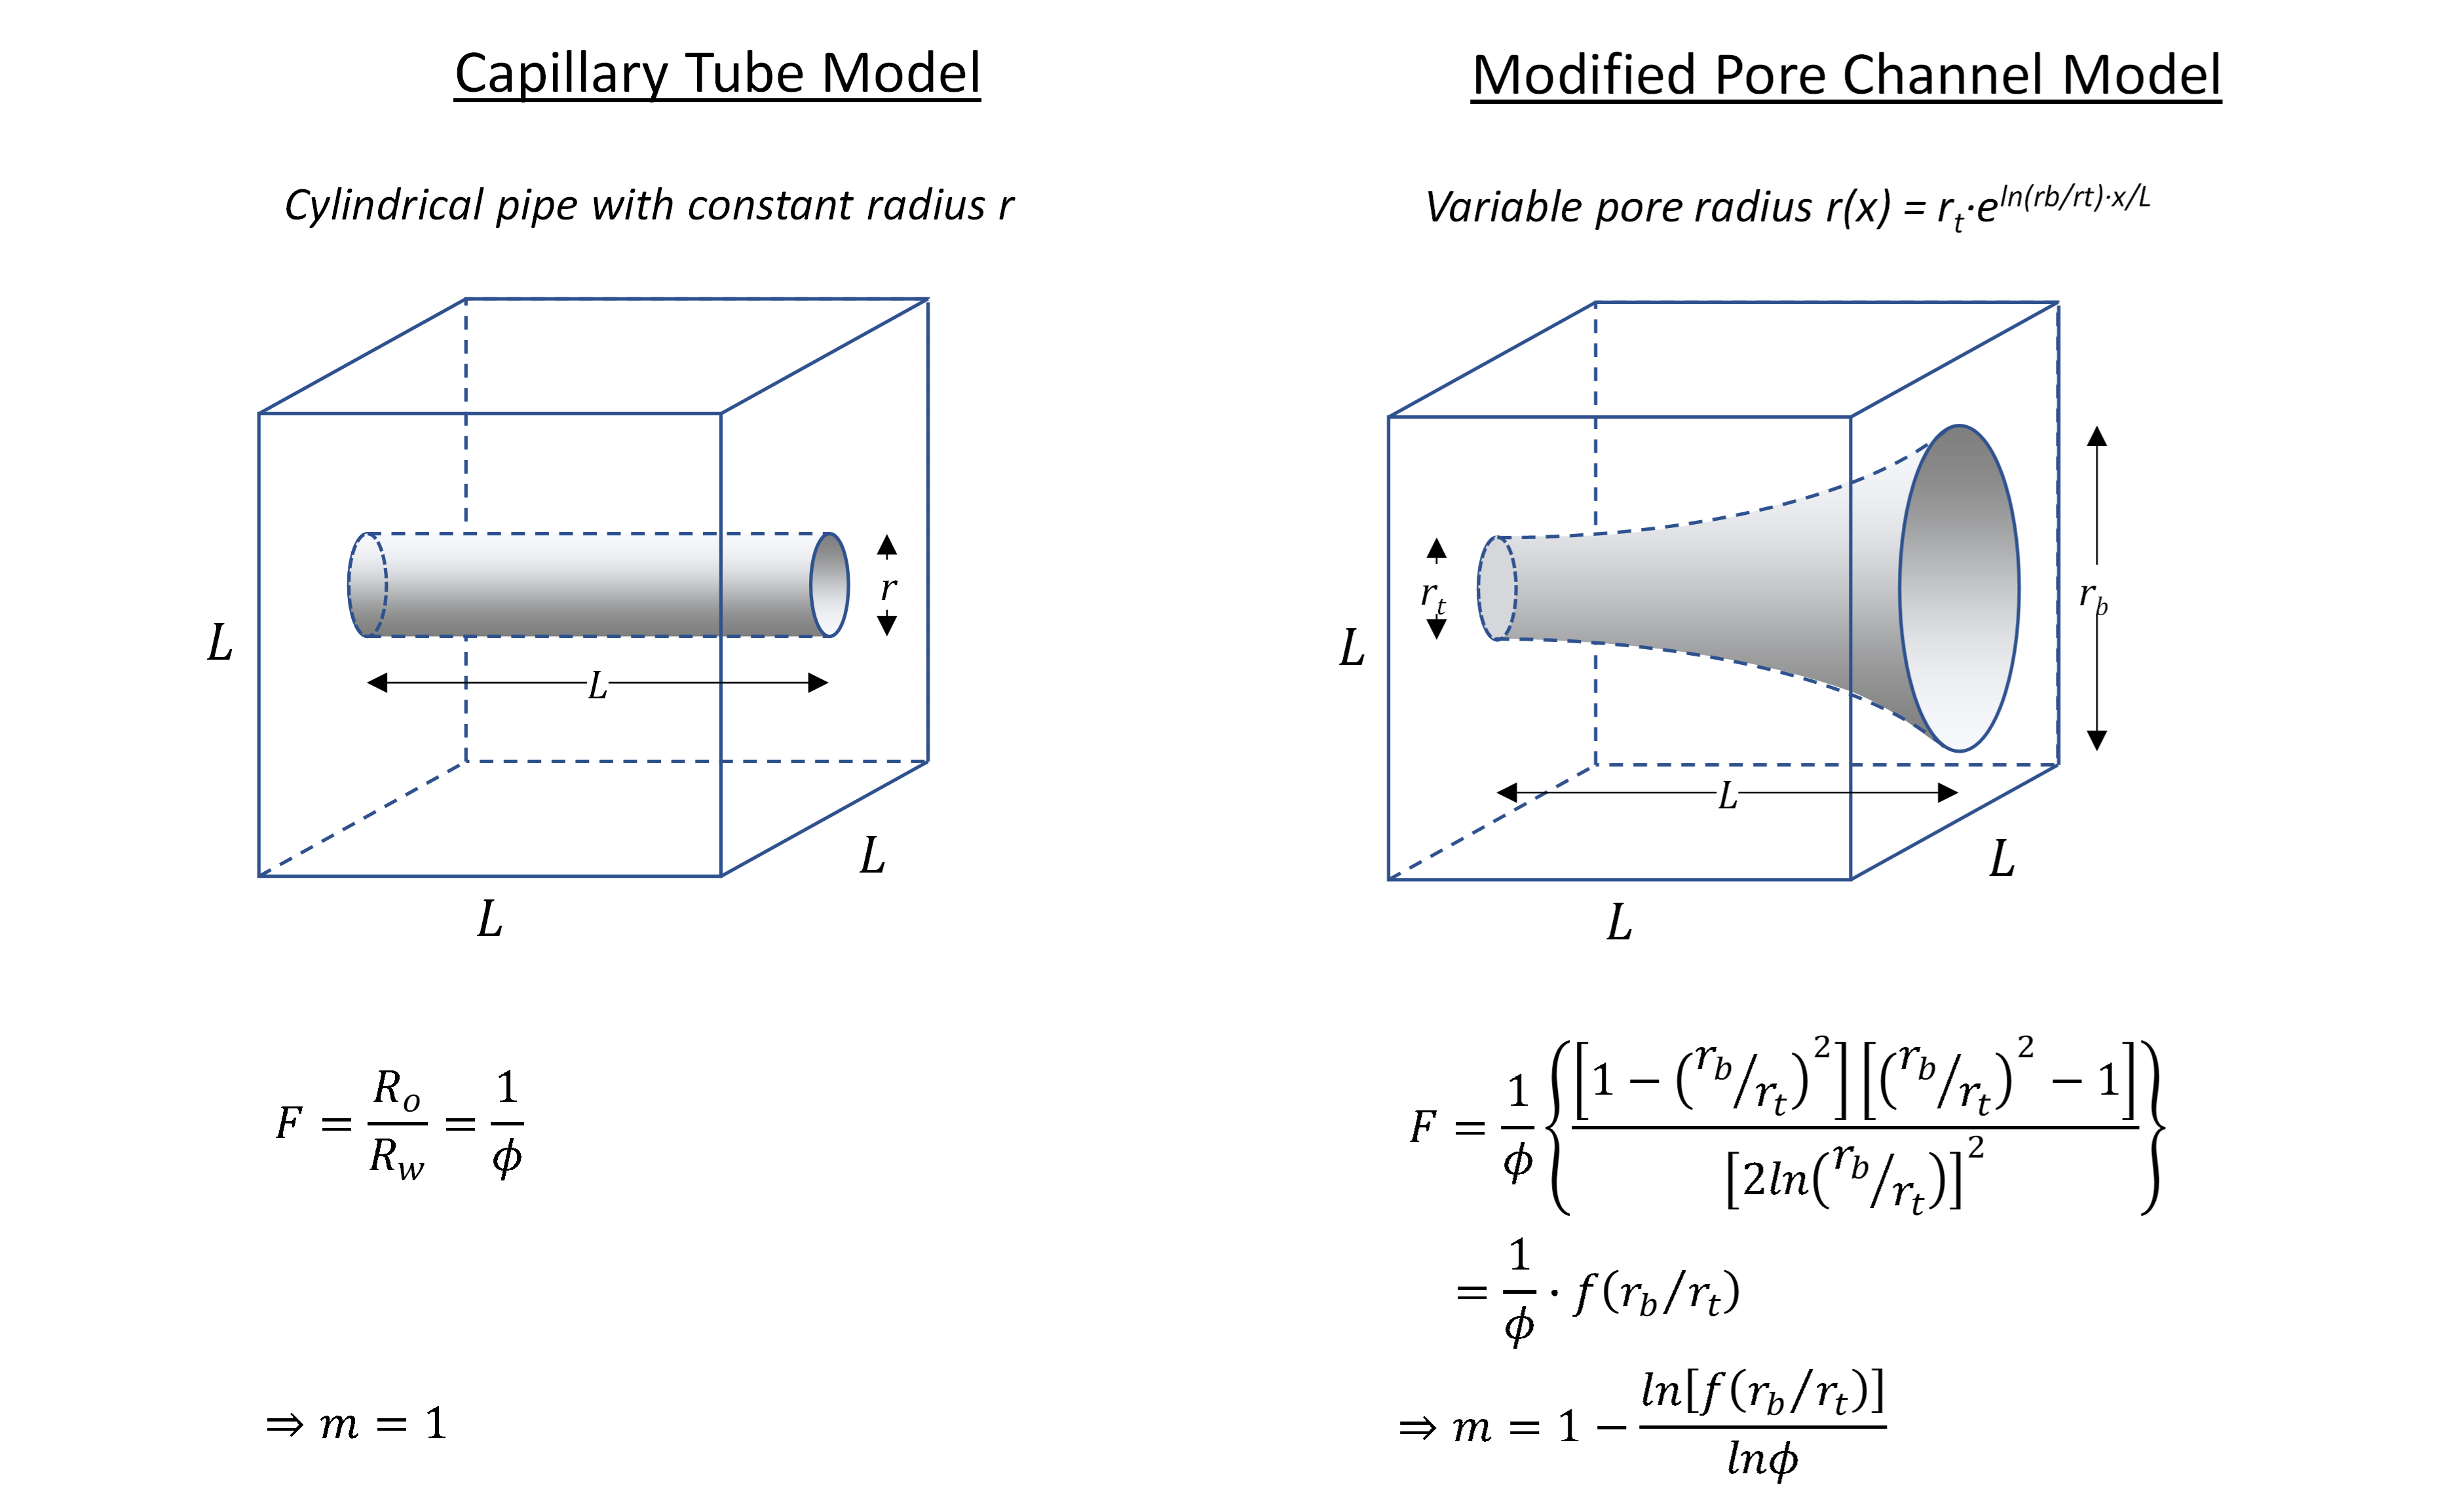
Whilst the models presented appear simplistic, it is noted by Müller-Huber et al. that previous studies into pore shapes found that the actual pore shape only had a marginal influence on properties such as permeability in comparison to the changes that arise from changes to the pore body radius. Therefore, a simple mathematical model should allow the influence of different pore types to be captured. Conceptually a fracture would have a very similar pore throat and pore body size, thus the ratio rb/rt is close to unity. A vug has a much larger pore body in comparison to the pore throats, thus high values of rb/rt should be expected.
The modified pore channel model is compared to a simple capillary tube model. It can be shown that the resistivity of this model reduces to Archie’s equation with m = 1. Using a similar approach, it is determined that the modified pore channel model also reduces to Archie’s equation and that the cementation exponent is a function of both the rb/rt ratio and the porosity.
Where both the porosity and cementation exponent are known it is possible to calculate the rb/rt ratio and thus start to conceptualise the nature of the porosity in the reservoir. The initial step to establish the f(rb/rt) value is straightforward:
Rather than solve for rb/rt directly a polynomial correlation between rb/rt and f(rb/rt) is determined and used to mathematically relate the two values.
Where:
x = f(rb/rt)
As a rule of thumb rb/rt values in excess of 20 represent larger pore geometries such as vugs. A log of rb/rt can be used to discriminate different lithofacies within a carbonate reservoir and identify the nature of the porosity present.
As a guideline the values of m and rb are the only inputs that are needed to simplistically define a rock fabric. We split rocks into two very broad groups – sandstones (siliclastics) and carbonate. Within each of these groups there are a range of textures with typical values for the cementation exponent and the average pore body radius. Note that these values are guidelines only and have been tabulated based on literature review and data analysis of the Pasca A carbonate reef in Papua New Guinea.
| Sandstone | Carbonate | ||||
|---|---|---|---|---|---|
| m | rb (mm) |
m | rb (mm) |
||
| Very fine grain | 2.0 | 0.005 | Chalky | 1.8 | 0.01 |
| Fine grain | 1.9 | 0.01 | Cryptocrystalline | 2.0 | 0.1 |
| Medium grain | 1.8 | 0.05 | Inter-crystalline | 2.2 | 0.2 |
| Coarse grain | 1.8 | 0.1 | Sucrosic | 2.5 | 0.5 |
| Conglomerate | 1.5 | 0.2 | Fine Vuggy | 3.0 | 5.0 |
| Unconsolidated | 1.3 | 0.05 | Coarse Vuggy | 3.5 | 30.0 |
| Fractured | 1.2 | 0.1 | Fractured | 1.2 | 0.1 |
The key point is that to describe the pore geometry it is necessary to capture the tortuosity (average path length taken across a unit length of rock) and the average pore throat size. The cementation exponent, being a reasonably well understood parameter, is simple to implement and captures the nature of the tortuosity and pore geometry in the rock. By relating the pore geometry rb/rt to the cementation exponent, it is possible to determine the pore throat radius from the average pore body radius alone. This is also a simpler approach as it is easier to visually guesstimate the average size of pore bodies from core photos than it is to measure the average pore throat size.
Generally, both the cementation exponent and average pore body radius should be adjusted until the characteristic rock parameters determined from them either match or are consistent with the available data or expectations.