Even with modern computer hardware, reading and manipulating very large seismic datasets can often be time-consuming. This is partly related to the file structure of the SEG-Y format which was originally conceived as a tape-drive format. To examine how significant the worst-case read scenarios are a series of small benchmarks were created to test the speed of reading different types of line using a real dataset. It is found that whilst solid state drives do offer improvements over hard disk drives, the benefits are not as significant as might be theoretically anticipated. It is suggested that an improvement to both the file structure used to store seismic data and the use of low-latency physical storage media e.g. 3D Xpoint, is needed to deliver better responsiveness when reading seismic data.
Challenges Reading SEG-Y Seismic Data
The SEG-Y file format standard has been around for several decades since its original publication in 1975 and is widely used in the oil and gas industry. The standard was created with reference to tape drives which were the large format physical media available in that era. Since a tape drive much physically move the tape from one reel to another, the data reading and writing is sequential in nature. The physical constraints thus dictate the file structure where data is stored in traces and each trace is preceded by a trace header which describes the data that will follow in that trace. A set of traces can be combined to form a line.
With the advent of three-dimensional seismic data and a shift to random-access media such as hard disk drives, the SEG-Y format has retained its usefulness whereby data is written in sequential traces within a file. By slicing a 3D volume into back-to-back lines (similar to a salami-slicer), it is possible to store all data in a seismic volume in a single file. The downside of such an approach becomes readily apparent the first time a user attempts to access a large three-dimensional survey.
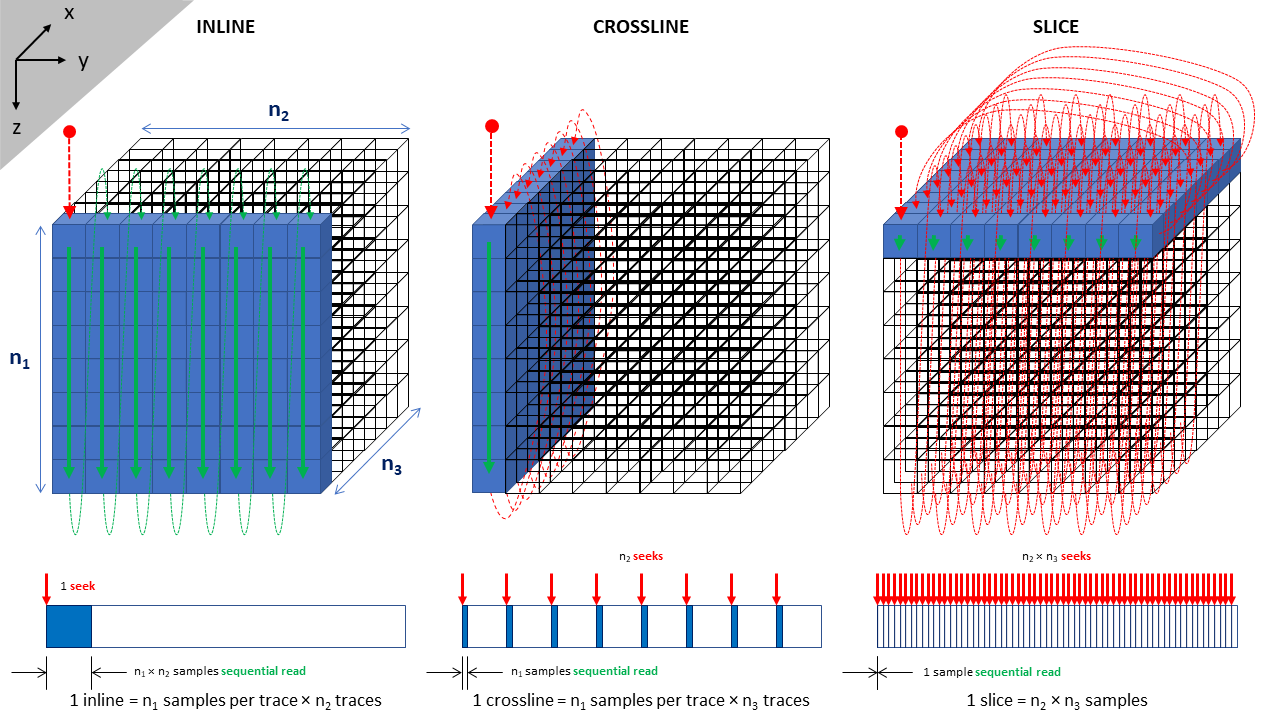
Access to data within a line that is parallel to the primary line direction used to store the data traces is fast. These lines are referred to as “inlines” and the data can be accessed using a sequential read method. Most physical media are designed to deliver fast sequential read speeds – a hard disk drive for example will store its data on a platter that spins under a read head mounted on an arm. By spinning the platter a stream of bits can be fed to the read head. The faster the drive spins and the greater the recorded data density, the higher the data rate that can be delivered. A typical data rate for hard disk drives in 2020 is 1,030 Mbit/s (million bits per second).
However, the same rate cannot be achieved for non-sequential data i.e. to access traces that are not stored in a logically sequential fashion within the file. If the data is not sequential, then it will be located on a different track and location of the hard drive platter. To access data stored on a different physical location of the platter it is necessary to both move the read head across the platter and allow for the rotational latency associated with waiting for the disk to rotate and reach the initial position that is to be read. Worst case rotational latency on a 7,200 rpm drive is 8.33 ms (60 / rpm) and the average latency is half this value (~4.17 ms). Seek time for a desktop hard disk drive in 2021 is around 8.5 ms. Note that there is very much a physical limitation regarding how fast a drive can seek and in comparison to data rates, the seek times for drives have not improved dramatically; typical seek times for drives in the 1970s were ~25 ms.
The consequence is that to read a line perpendicular to the primary line direction, referred to as a “crossline”, it is necessary to read a trace, seek to the start of the next trace, read that trace, seek to the next trace, read, seek, read, seek and so on… The sequential reads of each trace are still fast, but the addition of multiple seeks greatly slows down the overall read time for the crossline. The problem is compounded further if a planar line along the third axis, referred to as a “slice”, is desired. In this situation only a single sample is read sequentially and a seek to the start of the next sample is needed for each and every sample that is read. In theory this could add up to hours of time on a large 3D dataset, but in practice it is much faster taking mere ‘minutes’. For comparison an inline can be read in fractions of a second and a crossline in a few seconds.
Solving the Slice Read Time Using Hardware
As technology advances the cost and speed of storage increases. In 2021 it is possible to load a large seismic survey entirely into a computer’s RAM which eliminates the latency issue arising from an increased number of seeks. There is a time cost associated with this as the survey must still be stored on a physical media and loaded into volatile memory each and every time a program is run that will need to access the data and for very large surveys (>100 GB) this still is not a viable solution for most desktop workstations where 64 GB is seen as a generous memory specification.
There are other technology options available. The two main options are solid state drives (SSD) and Intel’s Optane drives which use a very different technology. Generally a solid state drive is a clear upgrade over the older hard disk drive technology, offering faster transfers and access times. This is possible through the elimination of moving parts, with data written to and read from NAND flash memory in a similar manner to how the computer accesses RAM, the difference being that NAND flash memory is non-volatile meaning that the data stored is not lost when the power is turned off or lost. Intel’s Optane solution uses 3D XPoint technology which offers much lower latency and hence a larger number of input/output operations per second (IOPS) for queue depth 1 which is the relevant metric by which to gauge how fast individual samples could be accessed when reading a slice. Most SSDs will quote their speeds at higher queue depths, for which parallel IO requests to the data on the drive is implied which increases the queue depth. The relevance of a higher queue depth will be examined in a later blog post. For direct comparison to hard drives, a queue depth of 1 is assumed since this is the mode under which hard drives effectively operate.
SSD speed is also affected by the interface used. With the much faster sequential read speeds available from an SSD, it is possible to saturate a SATA III interface (limited to 6 Gbit/s). This has led to the development of the NVMe interface which facilites access via the PCI Express (PCIe) bus at up to 32 Gbit/s.
Optane has not caught on popularity and there are few consumer-level drives available. It doesn’t help that as of 14 January 2021 Intel discontinued its consumer product line for Optane. Similarly Micron (with whom Intel jointly developed 3D XPoint) have only so far produced the data-centre oriented X100 drive and do not have any consumer-level products. Whilst Optane does not offer much advantage when it comes to loading times for the latest and greatest games, as will be seen, there is a tremendous advantage to be gained when it comes to reading large technical datasets like seismic data. This adds an incentive to get a hold of a drive to see what is possible with hardware that is aligned to the technical needs of the software. Sadly, despite attempts to order an end of product line drive, it was not possible to secure a drive for testing. Therefore Optane performance will need to remain, for the moment, theoretical from the perspective of this blog’s test approach.
Measuring Read Speed for 3D Seismic Volume
My PC has several different types of drives which allow for comparison of different code and hardware combinations. The drives currently installed include:
- Conventional hard disk drive (Toshiba PC P300 2TB)
- SATA III solid state drive (Crucial MX300 525GB)
- M.2 NVMe solid-state drive (Samsung 960 EVO 250GB)
A comparison of the stated specifications for each drive in addition to the Intel Optane 800p published specifications are as follows:
| Metric | Hard Drive | SATA III SSD | NVMe SSD | Optane |
|---|---|---|---|---|
| IOPS (QD1) | 118 | 12,000 | 14,000 | 55,000 |
| Seek time / latency (μs) | 8,500 | 83.3 | 71.4 | 18.2 |
| Data rate (Mbit/s) | 1,030 | 4,420 | 28,000 | 11,600 |
| Data rate (Mbyte/s) | 128.75 | 530 | 3,500 | 1,450 |
| Read time (ns) | 7.8 | 1.9 | 0.3 | 0.7 |
It is immediately apparent that SSDs offer a large improvement compared to hard drives both in terms of latency and the sequential read data rate. Optane offers the lowest latencies of any of the technologies plus a sequential read data rate that is an order of magnitude faster than a hard drive, but slower than an NVMe SSD. In order to test the real-world speed comparison between the drive technologies a 3D post-stack seismic volume with dimensions 1,966 x 1,103 x 3,001 is used to test reading inlines, crosslines and slices. A small benchmark program is used to randomly read 100 inlines, crossline and partial slices and the average time to read each float is calculated. These measured times can be compared against the theoretical read times which are computed based on the number of seeks and sequential bytes that are read for each line. Time for a seek is ‘t_s’ and time to read a sequential byte is ‘t_b’.
Each inline contains n_y (1,103) traces each containing n_z (3,001) float samples with 4 bytes per floating point number. All bytes are stored sequentially, therefore the read time is:
Each crossline contains n_x (1,966) traces each containing n_z (3,001) float samples with 4 bytes per floating point number. All bytes within a trace are stored sequentially but a seek to the start of each trace is required since traces are not sequential for a crossline. The read time for a crossline is:
Each slice contains n_x (1,966) by n_y (1,103) float samples with 4 bytes per floating point number. No samples are stored sequentially thus a seek is needed for each sample read in the slice. The read time for a slice is:
Combining the drive specifications and these equations gives the theoretical read times for each type of line.
| Metric | Hard Drive | SATA III SSD | NVMe SSD | Optane |
|---|---|---|---|---|
| Inline (μs/float) | 0.034 | 0.0076 | 0.0012 | 0.0028 |
| Crossline (μs/float) | 2.9 | 0.035 | 0.025 | 0.0088 |
| Slice (μs/float) | 8,500 | 83 | 71 | 18 |
| Average (μs/float) | 2,830 | 27.8 | 23.8 | 6.1 |
This suggests that both SSDs and Optane drives should be at least two orders of magnitude faster than a hard disk drive.
The measured times for each drive are as follows:
| Metric | Hard Drive | SATA III SSD | NVMe SSD |
|---|---|---|---|
| Inline (μs/float) | 0.064 | 0.024 | 0.017 |
| Crossline (μs/float) | 1.1 | 0.11 | 0.076 |
| Slice (μs/float) | 150 | 84 | 62 |
| Average (μs/float) | 49.1 | 28.0 | 20.8 |
The results are curious as the solid state drives are very close to the expected theoretical speeds, but the hard disk drive has a markedly faster read time for a slice in comparison to expectations. How is this possible if the hard drive has to complete a full seek for every sample? It appears that this is related to the disk buffer which provides a read-ahead functionality and allows a free read of bytes so that a complete seek is not needed before reading the next trace in a crossline or sample in a slice. For the Toshiba PC P300 drive being tested there is a 64 MB buffer which is enough for a few traces. Provided the slice is read along the direction of inlines, this means that the next sample should be in the read-ahead buffer thus eliminating the requirement for a new seek. The effective seek time for short seeks within a file on the hard drive is thus close to 0.15 milliseconds, not 8.5 milliseconds.
Because of this quirk, in practice the solid state drives, whilst faster, do not deliver a knock-out performance improvement. In particular the sequential read data rates fall short of the theoretical maximum. A quick check reveals that this is not because the respective interface (SATA III or NVMe) has been saturated.
Conclusions on Improving Read Times
Clearly hardware has a part to play. At the very least solid state drives should be used, although the benefit of an NVMe drive is minor in comparison to a cheaper (and larger) SATA III device. The question is whether a superior file structure can be devised such that the average read time for inlines, crosslines and slices are equally fast without greatly increasing the storage volume. A simple brute force solution is simply to record the volume three times so that there is an ‘inline’ storage layout for the inlines, crosslines and slices. Of course such an approach would triple the storage volume requirements but would deliver the best IO performance irrespective of the data plane being used.
In future blog posts I will look at alternative ways of structuring the data so that a balanced access to the different data planes is possible.