To apply a cubic equation of state to predict fluid properties, it is necessary to know the compositional breakdown of the substance of interest. For a pure fluid this is easy, as the breakdown is no more complex than 100% of that particular substance. This is considerably more challenging for actual reservoir fluids, particularly if the fluid is an oil, as opposed to a gas.
Breaking down a hydrocarbon mixture into its components is relatively straightforward if the components are light and simple. Components such as methane and ethane are readily discernible on a gas-chromatograph mass-spectrometer, and if a gas is very dry and comprises components that are pentanes (C5) or lighter, then a very accurate composition can be determined.
Once we get to hexanes (C6) and heavier, the picture starts to become more complicated. There are many different ways that six or more carbon atoms can be arranged, and the structure of the molecule affects the number of associated hydrocarbon atoms in the hydrocarbon, which in turn affects the properties of the pure compound.
Identifying the hundreds of different possible compounds is very rarely, if ever, undertaken. I say rarely because perhaps some masochistic PhD students have tackled this task. However, back in the real world, no oil and gas company ever obtains a complete breakdown of an actual reservoir fluid. The heavier components are always grouped into what are commonly referred to as “pseudo-components”. That is, a lumped fraction containing multiple distinct components, from which the average properties are obtained and used to represent lumped fraction as if it were a single pure component. For example it is very common to see distinct components for C5 and below, but a single C6 fraction and a C7+ fraction. The C6 fraction is a grouping of all compounds with six carbon atoms, and the C7+ fraction is a grouping of all compounds with seven or more carbon atoms.
Characterising Fractions
What properties are we interested in measuring for a lumped hydrocarbon fraction?
To use the lumped fraction in a cubic equation of state, it is necesary to know properties of the fraction such as the critical temperature, critical pressure and critical volume. Fortunately correlations exist for estimation of these properties from more easily measured properties such as the molecular weight and specific gravity. These two properties can be related to each other via knowledge of the types of hydrocarbon compound structures that are present in the lumped fraction. More specifically, if the structure of compounds (straight chain, branched chain, cyclic etc.) and the average number of carbon atoms is known, then the molecular weight and density can be determined. There are four properties of a hydrocarbon pseudo-component that are related to each other:
- Single Carbon Number (SCN): This is the average number of carbon atoms in the fraction. For a fraction that contained nothing except hexane, with six carbon atoms, the SCN would be 6.0. For a lumped fraction where nine in ten compounds were hexane, with the tenth being heptane (seven carbon atoms), the SCN would be 6.1. Note that even though you clearly can’t have a compound with 6.1 carbon atoms, as only a whole integer number of carbon atoms is physically possible, decimal single carbon numbers, which represent the average for the lumped fraction, are allowed.
- PNA (Paraffins, Naphthenes, Aromatics): The types of compounds within the lumped fraction. Paraffins are straight or branched chain alkanes. Naphthenes are cycloalkanes that contain one or more ring structures, with single bonds between all carbon atoms. Aromatics contain one of more ring structures, with double bonds. The relative ratios of these different types of compounds is referred to as the PNA ratio for the pseudo-component.
- Molecular Weight (MW): This is the weight in grams for 1 g-mol (mole) or in pounds for 1 lbm-mol of the lumped fraction. It is simple to determine if you know the average number of carbon and hydrogen atoms in the lumped fraction, as the molecular weights of the individual atoms do not vary and have been experimentally determined.
- Specific Gravity (SG): This is the density of the compound. More accurately, to use the currently accepted best practice term, it is the relative density in comparison to the density of water.
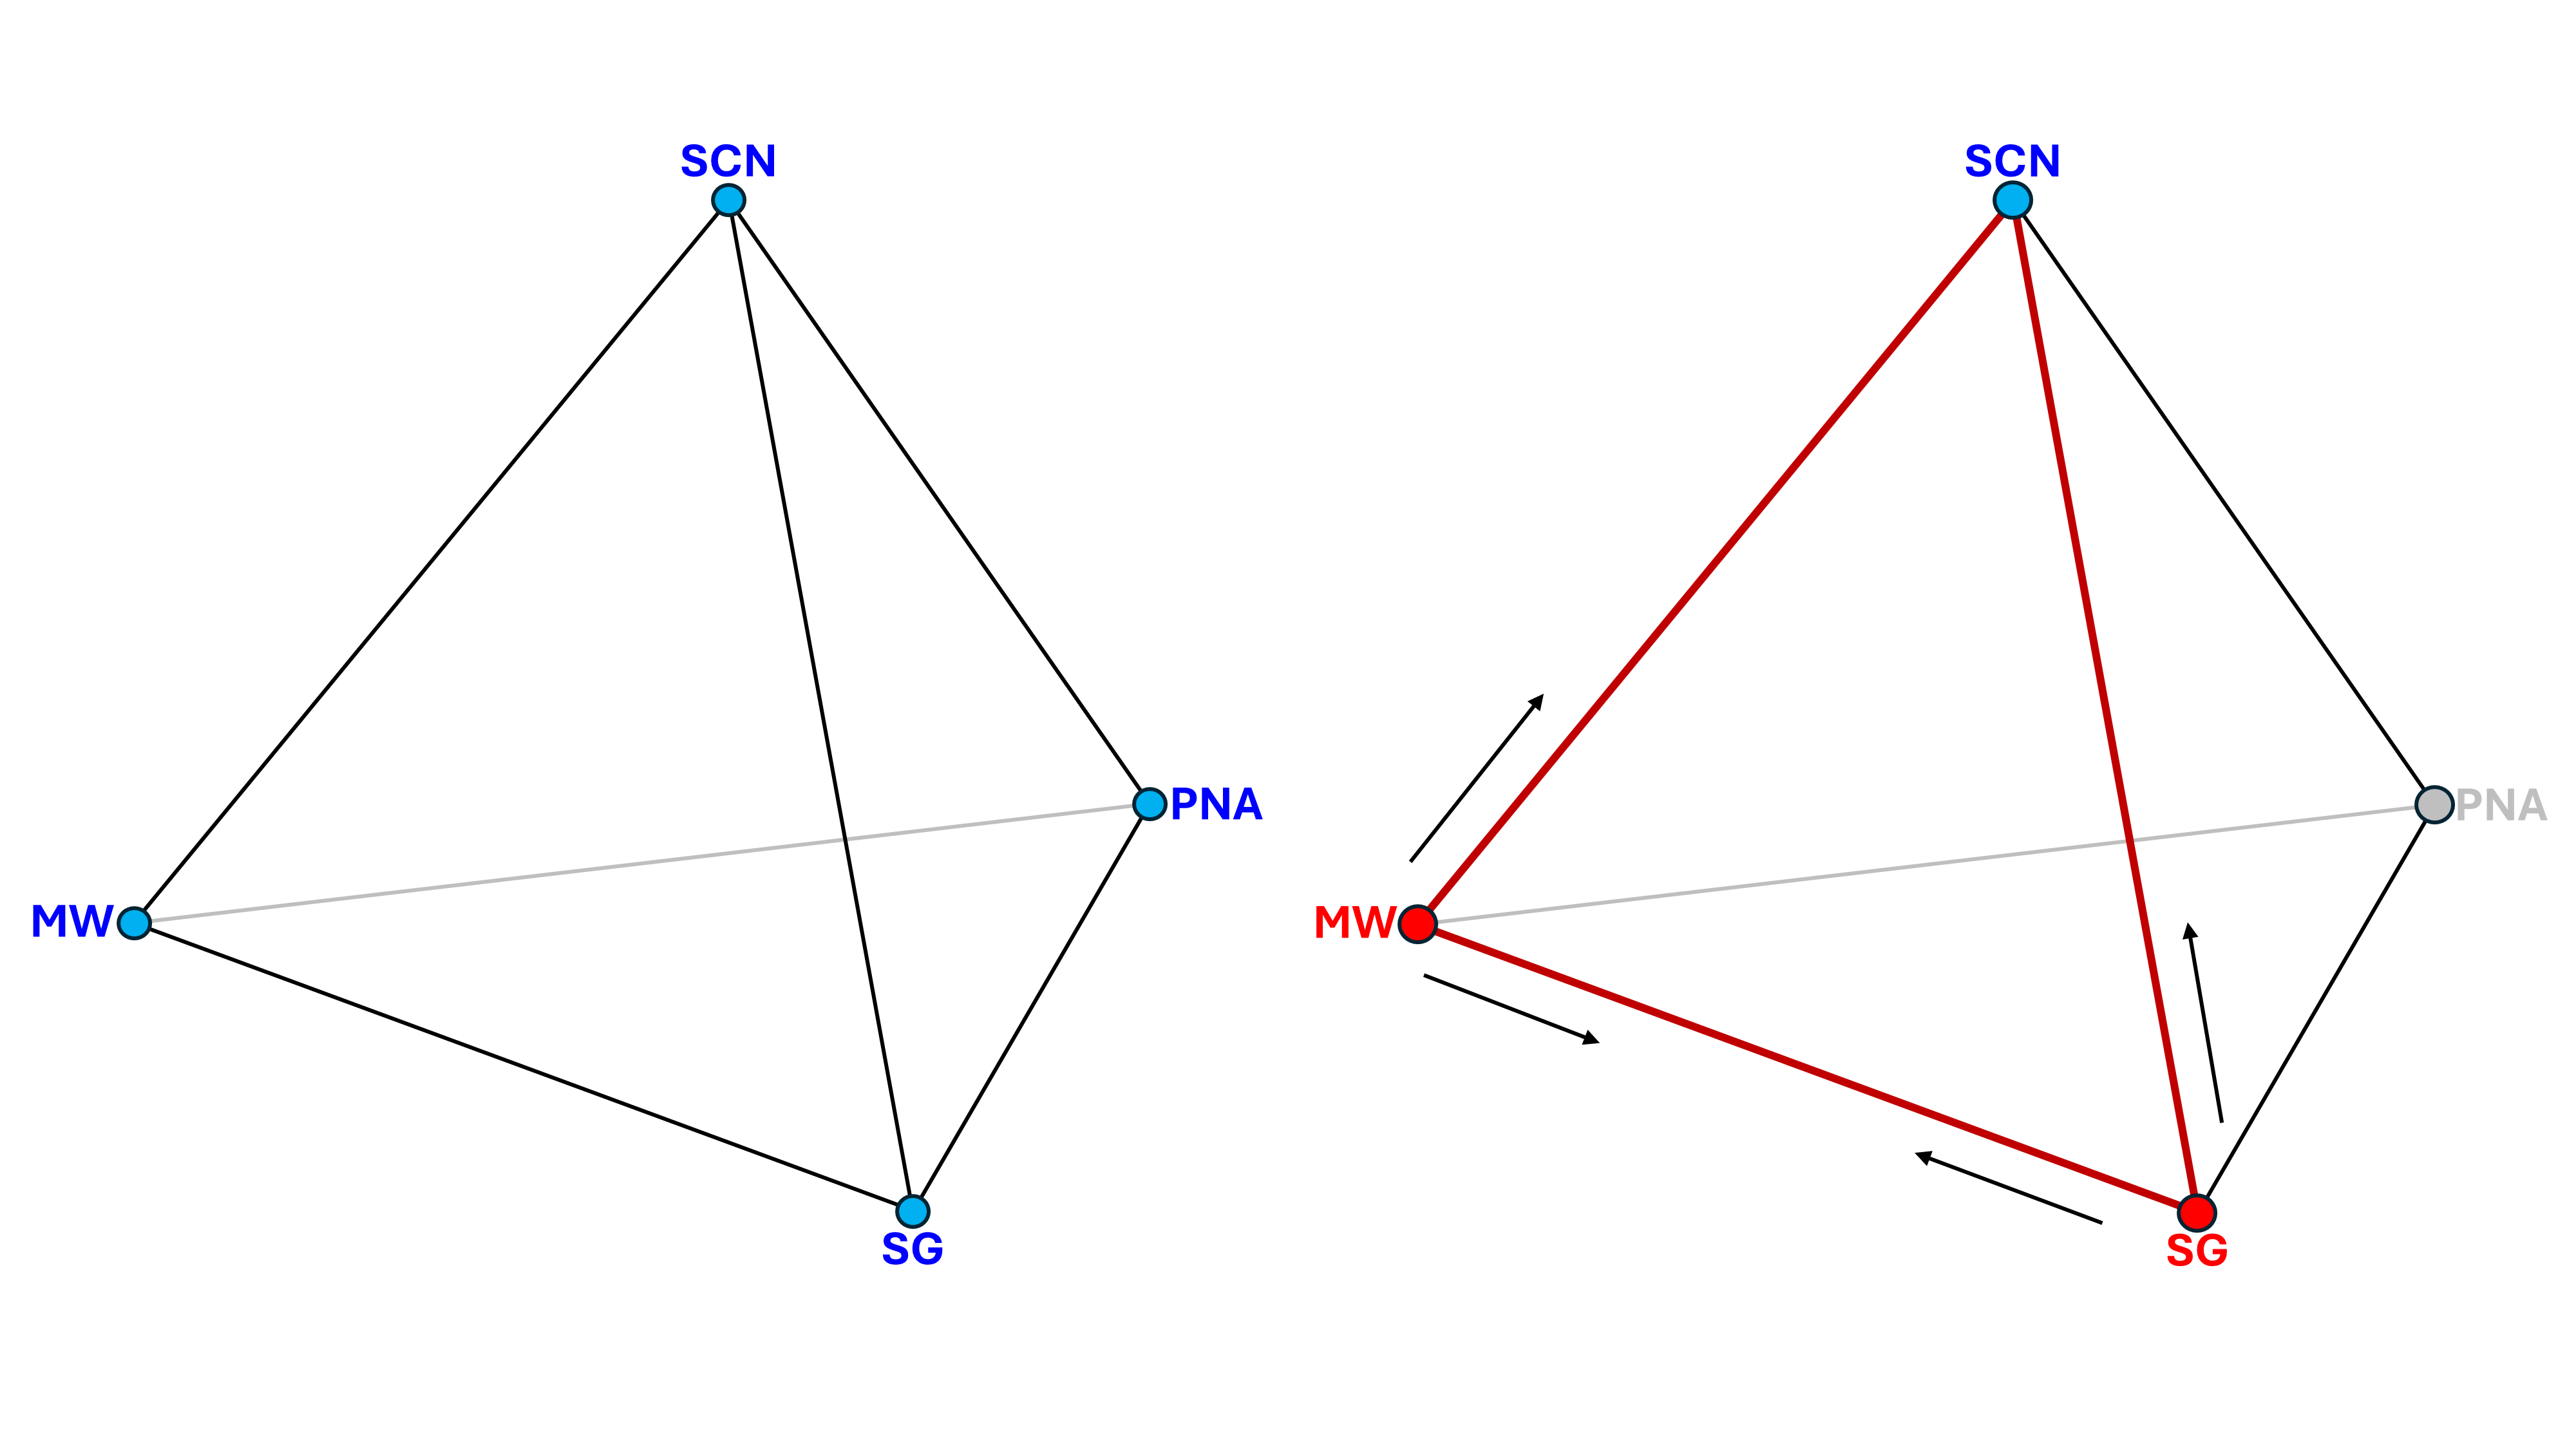
The relationship between these parameters can be visualised as a tetrahedron. All properties are related to each other. However, to determine any one unknown, only two other knowns are required. Thus, from just two values, the other two can be determined. Figure 1 shows the relationship between these parameters, and the example of how the single carbon number can be determined from knowledge of the molecular weight and specific gravity.
PNA Example for C6
To illustrate the different parameters let’s use six carbon atoms as an example. This is the lowest number of carbon atoms for which the different PNA compounds exis, are commonly encountered and can be easily visualised. Assuming you have Javascript-capable browser, and the underlying service used to generate the 3D molecules doesn’t break, you should be able to manipulate and molecules in order to better understand their structure.
Note that all the compounds shown for C6 have a single carbon number of 6.0.
The key property parameters for the molecular weight and specific gravity are shown for each compound. This shows that for a constant single carbon number, as we move from paraffins through naphthenes to aromatic variants, the molecular weight decreases and the specific gravity increases. The decrease in molecular weight arises because the number of hydrogen atoms associated with each carbon atom decreases. The increase in specific gravity is mainly due to the more compact and dense molecular structures of naphthenes and aromatics compared to paraffins. The cyclic structures allow for a higher number of atoms to be packed into a given volume, increasing the specific gravity.
Hexane
Hexane, C6H14, is a paraffinic straight-chain alkane with six carbon atoms.
| MW | SG |
|---|---|
| 86.1772 | 0.6638 |
2-Methylpentane
2-Methylpentane (or iso-hexane), C6H14, is a paraffinic branched-chain alkane with six carbon atoms.
| MW | SG |
|---|---|
| 86.1772 | 0.6562 |
Cyclohexane
Cyclohexane, C6H12, is a cycloalkane (naphthene) with six carbon atoms. The cyclohexane molecular comprises a single ring structure, with single bonds between each carbon atom. There are two hydrogen atoms attached to each carbon atom.
| MW | SG |
|---|---|
| 84.1613 | 0.7835 |
Benzene
Benzene, C6H6, is the least complex aromatic hydrocarbon. The benzene molecule is composed of six carbon atoms joined in a planar hexagonal ring with one hydrogen atom attached to each.
| MW | SG |
|---|---|
| 78.1136 | 0.8829 |
Relating PNA to Specific Gravity, Molecular Weight, and Single Carbon Number
What we need is a recipe to work out the relationship between these parameters. Below are snippets of Java code used in the Pyrus Suite that are used to achieve this aim. The code was hand-crafted by myself, based on equations published in the literature (see references at the end of this article). I consider it sufficiently well commented, such that another engineer should be able to easily work out the purpose of each method, especially if they are also referring to the same literature.
MW <-> SCN <-> PNA
Fortunately relating molecular weight to single carbon number, where the PNA ratios are defined, is straightforward. In many ways it can be considered exact. This is controlled directly by the molecular mass of carbon and hydrogen, and the number of each found for a given single carbon number, whether paraffin, naphthene or aromatic. Note that only single ring aromatics are considered; a more sophisticated formula to work out the number of hydrogen atoms for an aromatic with more than one benzene ring as the SCN increases is certainly possible, but has not been considered at this stage.
/**
 * Determine the molecular mass from the equivalent single carbon number and the PNA fractions. For any given single
 * carbon number, the ratio of carbon and hydrogen atoms is determines by the molecular structure. Therefore this
 * method will return a mass that is closely tied to the typical molecular structures that are found for paraffins,
 * naphthenes and aromatics.
 *
 * @param scn single carbon number
 * @param p proportion of pseudo-component comprising straight chain or branched paraffins
 * @param n proportion of pseudo-component comprising cyclic (saturated) ring as major structure
 * @param a proportion of pseudo-component comprising mono-aromatic (single ring)
 * @return the estimated molecular weight
 */
public static double estimateMass(double scn, double p, double n, double a) {
    return p * (scn * 12.011 + (scn * 2.0 + 2.0) * 1.00794) + n * (scn * 12.011 + (scn * 2.0) * 1.00794)
            + a * (scn * 12.011 + (scn * 2.0 - 6.0) * 1.00794);
}
SG <-> MW <-> PNA
With molecular weight, single carbon number and PNA, three out of our four parameters can be related. What is missing is a relationship to determine the specific gravity. An approach that can be taken is to estimate the PNA ratios from the commonly measured mass and density. This is the only additional relationship that is required.
Riazi and Daubert (1986) developed several correlations to predict paraffin and napthene content from readily available or predictable parameters, including the refractivity intercept, specific gravity, ‘m’ (a parameter whose value determines the hydrocarbon type) and the carbon to hydrogen weight ratio.
/**
 * Follows method of Riazi and Daubert to estimate fractions of paraffins, naphthenes and aromatics based on the
 * refractivity intercept and viscosity gravity constant (VGC) or function (VGF). Method assumes that main
 * characterisation parameters such as molecular weight, normal boiling point and specific gravity have already been
 * set.
 *
 * @param mass the component mass in g/mole
 * @param gamma the component specific gravity
 * @return PNA characterisation fractions [p, n, a, pa, ma] where p is paraffin, n is naphthene, a is aromatic, pa
 * is polyaromatic and ma is monoaromatic. Note p + n + a = 1.0 and pa + ma = a.
 */
public static double[] estimatePNA(double mass, double gamma) {
    double n_ri = PVT.refractiveIndex(gamma, PVT.plusBoilingPointSoreide(mass, gamma));
    double m = mass * (n_ri - 1.475); // parameter m that identifies hydrocarbon types
    double d = PVT.densityTwenty(gamma);
    double ri = PVT.refractivityIntercept(n_ri, d);
    double ch = PVT.carbonHydrogenWeightRatioGoossens(mass, n_ri, d);
    double p, n;
    if (mass <= 200.0) {
        p = 3.7387 - 4.0829 * gamma + 0.014772 * m;
        n = -1.5027 + 2.10152 * gamma - 0.02388 * m;
    } else {
        p = 1.9842 - 0.27722 * ri - 0.15643 * ch;
        n = 0.5977 - 0.761745 * ri + 0.068048 * ch;
    }

    // Defensive check in case paraffinic content is more than 100%
    if (p >= 1.0) {
        p = 1.0;
        n = 0.0;
    }

    // Check if aromatic fraction is negative and set equal to zero if so and nomalise x_p and x_n
    double a = 1.0 - (p + n);
    if (a < 0.0) {
        a = 0.0;
        p *= 1.0 / (p + n);
        n *= 1.0 / (p + n);
    }

    // Estimate the monoaromatic and polyaromatic fractions if aromatics are present. We calculate the monoaromatic
    // fraction as 1.0 - polyaromatic fraction rather than using the formula:
    // ma = max(-62.8245 + 59.90816 * ri - 0.0248335 * m, 0.0);
    double pa = 0.0, ma = 0.0;
    if (a > 0.0) {
        pa = max(11.88175 - 11.2213 * ri + 0.023745 * m, 0.0); // formula appears to generate a percentage
        ma = a * (1.0 - pa);
        pa = a - ma;
    }
    return new double[]{p, n, a, pa, ma};
}
Various static methods are utilised from a class PVT in this technique that implement the equations for determining n_ri (the sodium D-line refractive index at 20 °C and 1 atm), d (the density at 20 °C), ri (the refractivity intercept) and ch (the carbon to hydrogen weight index). The plus fraction boiling point is also determined following the method of Soreide (1989).
public class PVT {

    /**
     * Estimate the carbon-hydrogen weight index from properties of the hydrocarbon fraction.
     *
     * @param mw molecular weight of the compound
     * @param n Sodium D line refractive index n of liquid at 20 degrees Celsius and 1 atm, dimensionless
     * @param d density d20 at 20 degC and 1 atm in g/cc
     * @return
     */
    public static double carbonHydrogenWeightRatioGoossens(double mw, double n, double d) {
        double pct_h = 30.346 + (82.952 - 65.341 * n) / d - (306 / mw);
        double ch = 100.0 / (-1.4734 + 1.27274 * pct_h);
        return ch;
    }

    /**
     * Liquid density at 20 degrees Celsius and 1 atm is a useful characterisation parameter. Rule of thumb is that d20
     * is approximately 0.995 * specific gravity.
     *
     * @param so oil specific gravity (water = 1.0)
     * @return the density d20 at 20 degC and 1 atm in g/cc
     */
    public static double densityTwenty(double so) {
        return so - 4.5e-03 * (2.34 - (1.9 * so));
    }

    /**
     * Determines the normal boiling point of a crude based on its the molecular weight and specific gravity. This
     * follows the correlation method of Soreide. See Soreide, I. 1989. Improved Phase Behavior Prediction of Petroleum
     * Reservoir Fluids from a Cubic Equation of State. PhD dissertation, Norwegian Inst. of Technology, Trondheim,
     * Norway. The relationship is based on the assumption that the boiling point of extremely large molecules
     * approaches a finite value of 1071.28 degrees Kelvin.
     *
     * @param mo molecular weight of oil in lbm/lbm-mol
     * @param so oil specific gravity (water = 1.0)
     * @return the normal boiling point in degrees Rankine
     */
    public static double plusBoilingPointSoreide(double mo, double so) {
        double tb_k = 1071.277778 - 9.416667e04 * pow(mo, -0.03522) * pow(so, 3.266)
                * exp(-4.922e-03 * mo - 4.7685 * so + 3.462e-03 * mo * so);
        return tb_k * 1.8; // convert degrees Kelvin to degrees Rankine
    }

    /**
     * Modification by Tsonopoulos based on various coal liquid samples. Can be applied to hydrocarbons with molecular
     * weight from 70 to 700 which is nearly equivalent to boiling point range of (90 to 1050 degF) and an API gravity
     * range of 14.4 to 93. The equation is recognised as the standard method of estimating molecular weight of
     * petroleum fractions in the industry.
     *
     * @param tb normal boiling point in degrees Rankine
     * @param so oil specific gravity (water = 1.0)
     * @return the molecular weight in lbm/lbm-mol
     */
    public static double plusMolecularWeight(double so, double tb) {
        tb /= 1.8; // convert from degrees Rankine to Kelvin
        double mw1 = 1.6607e-04 * pow(tb, 2.1962) * pow(so, -1.0164);
        double mw2 = 42.965 * exp(2.097e-04 * tb - 7.78712 * so + 2.08476e-03 * tb * so);
        mw2 *= pow(tb, 1.26007);
        mw2 *= pow(so, 4.98308);
        return max(mw1, mw2);
    }

    /**
     * The refractive index of liquid hydrocarbon at a temperature of 20 degrees Celsius and pressure of 1 atmosphere.
     *
     * @param so so oil specific gravity (water = 1.0)
     * @param tb boiling point in degrees Rankine
     * @return Sodium D line refractive index n of liquid at 20 degrees Celsius and 1 atm, dimensionless
     */
    public static double refractiveIndex(double so, double tb) {
        double mw = plusMolecularWeight(so, tb);
        tb /= 1.8; // convert from Rankine to Kelvin
        double i;
        if (mw <= 300.0) {
            i = 2.34348e-02 * exp(7.029e-04 * tb + 2.468 * so - 1.0267e-03 * tb * so);
            i *= pow(tb, 0.05721);
            i *= pow(so, -0.720);
        } else {
            i = 1.2419e-02 * exp(7.272e-04 * mw + 3.3223 * so - 8.867e-04 * mw * so);
            i *= pow(mw, 0.006438);
            i *= pow(so, -1.6117);
        }
        return sqrt((1.0 + 2.0 * i) / (1.0 - i));
    }

    /**
     * A plot of refractive index against density for any homologous hydrocarbon group is linear. Uses the refractivity
     * index and density to calculate the refractivity intercept. Values of n vary between about 1.3 for propane to 1.6
     * for some aromatics. Refractivity index is higher for aromatics compared to paraffins.
     *
     * @param n refractive index or refractivity (velocity of light in vacuum over velocity of light in substance)
     * @param d density of liquid hydrocarbon at reference state of 20 degC and 1 atm in g/cc
     * @return refractivity intercept Ri
     */
    public static double refractivityIntercept(double n, double d) {
        return n - (d / 2.0);
    }
}
Enter Katz and Firoozabadi
Relating MW, SCN, SG and PNA might seem a little excessive. After all modern laboratory analysis performed on hydrocarbon samples will provide a breakdown of components to much higher single carbon numbers than just seven. Breakdowns to C36+ fractions are common. Surely the laboratory report is accurate and has correctly identified the components present in the fluid?
The answer is a somewhat evasive “yes” and “no”.
It is important to remember that these fractions are not pure components and comprise a blend of many different paraffins, naphthenes and aromatics (both mono-aromatic with a single benzene ring and poly-aromatic with multiple rings). Gas Chromatography-Mass Spectrometry (GC-MS) generates a characteristic plot of the contents of a mixture.
The gas chromatograph separates compounds by their size using a capillary column. This column leads to separation of the mixture into different components, based on their weight. Lighter compounds such as methane travel through the column more quickly, and are the first compounds analysed by the mass spectrometer. Heavier compounds take longer to exit the capillary column (the retention time is higher) and are analysed later.
Mass spectrometry is used to determine the mass of each compound as it elutes (exits) the capillary column. The mass spectrometer captures the gas, ionises the particles and then accelerates the charged particles through a magnet. The differing mass and charge associated with each compound leads to a different amount of deflection as the particles pass through the magnetic field and can be captured using a detector.
The combination of gas chromatography and mass spectrometry allows for a finer range of substances to be identified. The result is a breakdown into distinct single carbon number fractions, with the proportion of each fraction identified in terms of its mass (or weight percentage) in the mixture.
Implied PNA Fractions for Katz-Firoozabadi Fractions
A laboratory will often apply GC-MS separately to the vapour and liquid fractions of a hydrocarbon, and then perform a recombination analysis to deduce the combined mixture composition. To perform the recombination analysis it is necessary to know both the mol% fraction of each component, and the molecular weight of all the components and pseudo-components. The problem is that for any given hydrocarbon group, Cn, where ‘n’ represents the single carbon number, the relative fractions of paraffins, naphthenes and aromatics (both mono-aromatic and poly-aromatic) will influence the molecular weight, and hence the mol% of each component. The solution used by many laboratories is to perform the analysis under the assumption of a ‘generic’ set of hydrocarbon group properties that are referred to as the Katz-Firoozabadi fractions.
Where does the Katz-Firoozabadi data come from?
In their paper, Katz and Firoozabadi (1978) were not actually trying to provide properties for generic single carbon number fractions, but rather they were aiming to determine binary interaction parameters between methane and hydrocarbon components, in particular the last heaviest fraction. The data on fractions that they presented was a means to an end, to allow true boiling distallation data to be used to generate wider range of components, other than a single C7+ fraction. The table they presented is shown on the left in Figure 2.
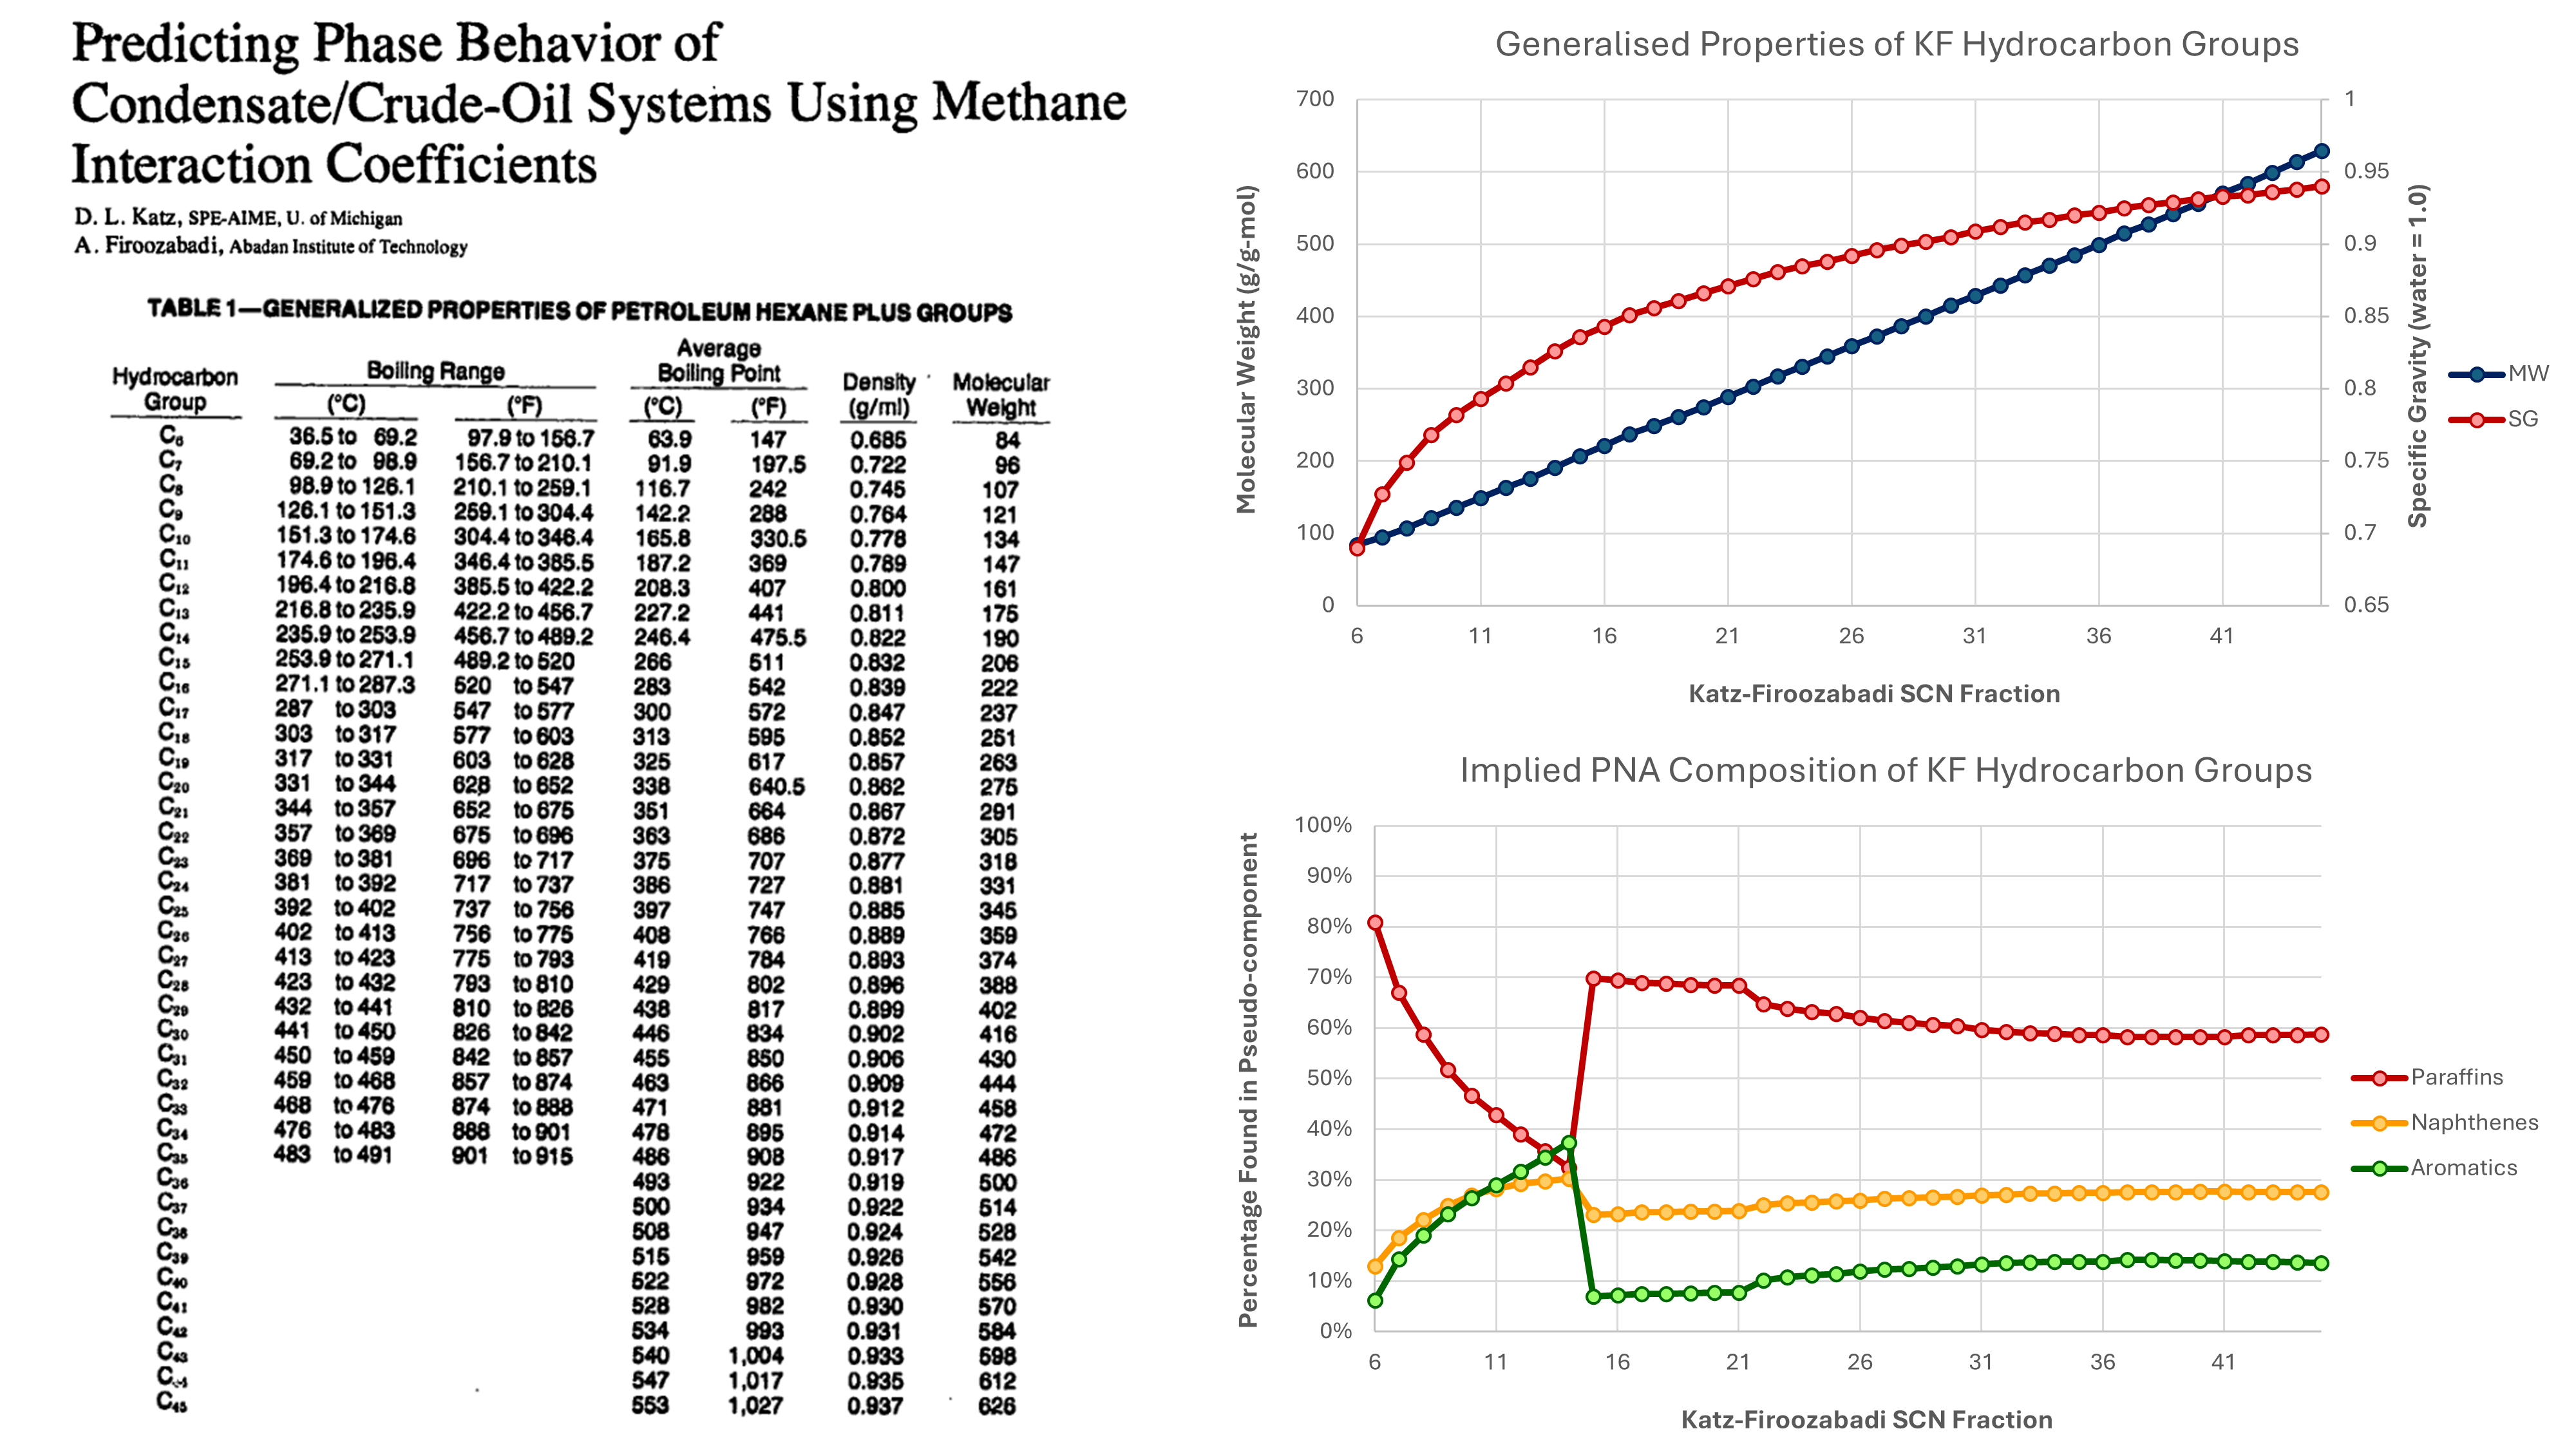
Katz and Firoozabadi obtained their data from a variety of sources. It is stated in their paper that properties for fractions from C6 to C15 were taken frm Bergman et al. (1975). It is stated that “this correlation was extended to a normal boiling point of 500 °C using added data for use with reservoir condensates and crude oils”. The additional data was sourced from two papers by Hoffman et al (1953) and Evans and Harris (1956). Hoffman et al evaluated true boiling point distillation data on cuts up to C22. In the top right chart of Figure 2, it can be seen that that molecular weight and specific gravity appear to increase smoothly along with increasing single carbon number.
Using the methodology described earlier in this post, it is noted that we have available MW and SG (and SCN). From this we can determine PNA for each fraction. A plot of the PNA composition for KF fractions versus KF single carbon number is shown in the bottom right chart of Figure 2. This is interesting as unlike the apparent smoothness of the molecular weight and specific gravity versus single carbon number, there is a distinct discontinuity in the PNA character at the single carbon number of 15. Perhaps not coincidentally, this is also the highest carbon number that was reported by Bergman et al (1975).
There also appears to be a second discontinuity at a single carbon number of 22. Again, this is perhaps not coincidental since it aligns to the highest single carbon number assesed by Hoffman et al (1953).
Implications for Interpreting Laboratory PVT Reports
The Katz-Firoozabadi (KF) properties over time have become ubiquitous. It is entirely possible that many reservoir engineers have never really considered the origins of the data. Nor, I suspect, do many reservoir engineers necessarily appreciate that the laboratory measured compositions that are so carefully entered into PVT simulations, are based on these generic assumptions.
Given that there are two discontinuities in the implied PNA character for the fractions, it would be reasonable to conclude that an improved set of generic single carbon number fractions could be produced, where the PNA fractions vary smoothly with increasing SCN. The associated MW and SG could then be determined from these values.
An alternative conclusion is that the laboratory analysis should be used carefully, with more emphasis applied to values such as the wt% for different components, and data such as the recombined mol% composition should not be treated as immutable. It is indicative only. By tuning the PNA composition for the fractions, and applying this to the wt% composition, a revised recombination calculation can be performed to determine the mixture composition. Thus varying the PNA composition can be used as a method for tuning an equation of state.
Having information on the PNA composition also opens the door to the application of group contribution methods for equation of state modelling. That will be covered in a future blog post…
References
- Katz, D. L. and Firoozabadi A. 1978. Predicting Phase Behavior of Condensate/Crude-Oil Systems Using Methane Interaction Coefficients. J Pet Technol 30 (11): 1649-1655. SPE-6721-PA. https://doi.org/10.2118/6721-PA
- Riazi, M. R. and Daubert, T. E. 1986. Prediction of Molecular Type Analysis of Petroleum Fractions and Coal Liquids. Industrial and Engineering Chemistry, Process Design and Development 25 (4): 1009-1015.
- Soreide, I. 1989. Improved Phase Behavior Prediction of Petroleum Reservoir Fluids from a Cubic Equation of State. PhD dissertation, Norwegian Inst. of Technology, Trondheim, Norway.

