One of the uncertainties associated with the resource estimate for carbonate reservoirs is the average field porosity. When wells are drilled which experience large losses of mud into the formation, the mud and filtrate will fully invade the larger pore spaces deep into the formation, and thus the logs will fail to recognise the true porosity. Furthermore carbonates can be very heterogeneous, with many diagenetic processes affecting the porosity post-deposition.
Having core can help mitigate the problems experienced with logs, but often the core plug measurements are taken on the best part of the core, which again gives a false impression of the overall porosity.
The Core Analysis Challenge
Best practice for any evaluation effort is to start with the raw data itself, and understand the limitations of how it was acquired and interpreted. Often this is not straightforward as the core recovery was not high to begin with, and the core may have been stored in uncertain conditions. It may also be the case that there is a limited amount of core, in which case the preference would be to use non-destructive analytical techniques, such as MRI or CT scanning to build up a picture of the pore space within the core. As a pre-cursor to these activities high resolution photographs of the core can be taken, to investigate whether the more expensive scanning techniques might yield any benefits.
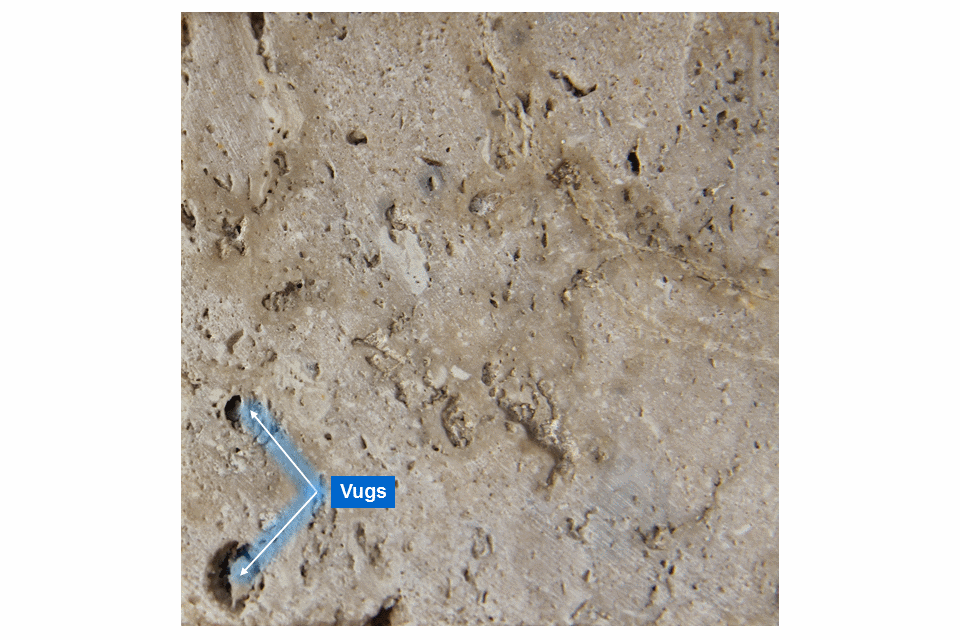
An example section from a carbonate core photograph is shown in Figure 1. This illustrates that there is visible macro porosity in the form of vugs, and this immediately suggests that the reservoir could have a significant porosity. These vugs are easily identified and are typically associated with flow of fluids through a reef post-deposition, which have contributed to dissolution porosity.
Another aspect of porosity development in carbonates is associated with formation of dolomite. Dolomite forms as a result of mineral alteration whereby calcium ions in calcite are replaced by magnesium ions. This is evidence of freshwater incursion into the reef, mixing with saline formation water. As a result of the dolomitization porosity is generated because of a volume reduction in the carbonate matrix.
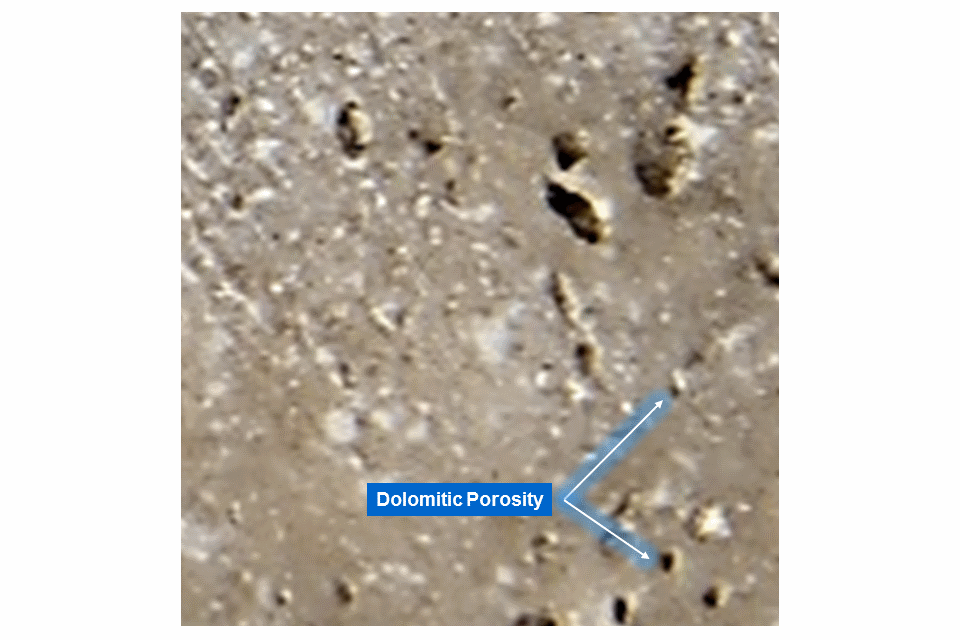
Analogue carbonate reservoirs with vuggy porosity can easily develop effective porosity of 20 percent or higher. If we suspect that the log measured porosity is not fully capturing the true porosity because of fluid invastion, the question remains whether it is possible to justify the use of a higher porosity upside based on the core? To answer this question it is first necessary to measure the visible porosity from the core photograph.
It should be noted that it is also expected that microporosity will be present in the carbonate matrix, but it is not possible to measure this through a simple visual technique. Therefore any visual porosity estimate technique will be an underestimate of the true porosity.
Using ImageJ To Calculate Porosity
The ImageJ open source image processing program can be used to manipulate images and identify features. In particular it permits thresholding of an image, whereby an image can be converted to a binary image, by setting specific conditions for characterisation of the image as black or white. Statistics can be calculated for any binary image, at both a pixel level, and also through identification of discrete features. This should allow individual pore spaces to be captured and assessed.
In addition to identification and measurement of porosity, it should be possible to discern between different facies. In particular there are three different categories of carbonate facies that can be distinguished in the core photograph. These are:
- Biogenically altered facies which have a lighter hue, and are likely to be associated with algal matter.
- Dolomotized carbonate which has a darker hue.
- Background facies.
The goal is to use ImageJ to separate areas on the core photograph that represent porosity, biogenic facies, dolomite facies and carbonate matrix.
Extracting Features From Core Photographs
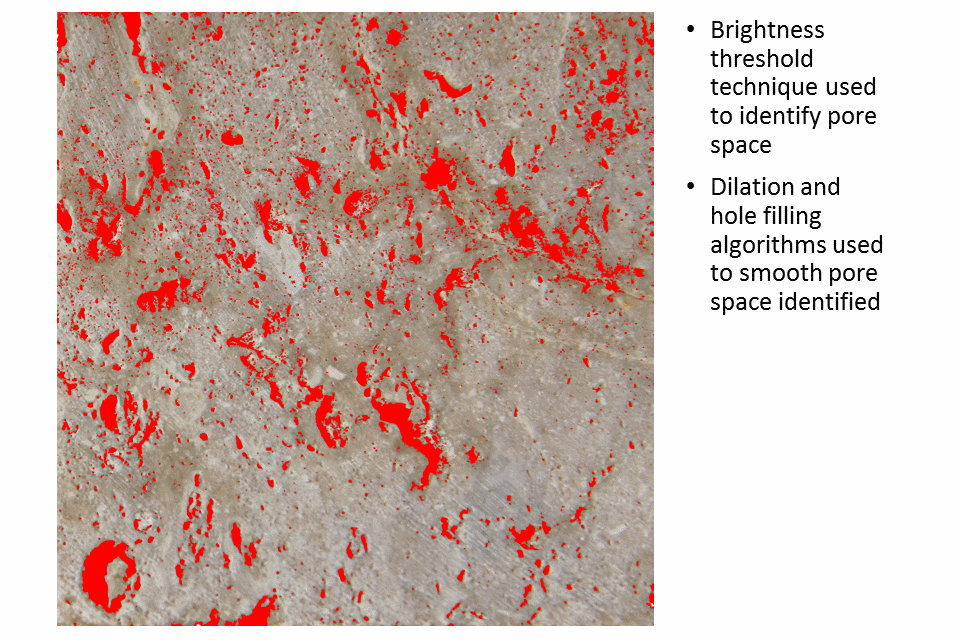
Generally the pore space in the core photograph will be darker. This is because light is reflected off the surface of the core, but there is less light that can enter the pore space directly and thus the pores tend to contain shadow. As a result we can convert the red, green and blue channel (RGB) to hue, saturation and brightness space (HSB), and apply a threshold filter based on brightness.
- Adjust the image levels using Image/Adjust/Window/Level… and select ‘Auto’ then ‘Apply’
- Sharpen the image using Process/Sharpen
- Apply a brightness threshold using Image/Adjust/Color Threshold. Choose ‘Thresholding method’ Yen, ‘Threshold color’ B&W, ‘Color space’ HSB.
- Using a red threshold colour initially and switching between the original and filtered image can help tweak the cut-off points used in the thresholding
- Convert to a binary image using Process/Binary/Make Binary
- Remove artefacts from porosity mask using Process/Binary/Dilate followed by Process/Binary/Fill Holes
The results are shown in Figure 3.
A similar strategy can be employed to distinguish the difference facies in the non-porosity areas of the image. In this instance the very lighter and darker areas of the image have been distinguished using the same threshold technique, but by adjusting the hue and saturation filters. Care has to be taken to avoid falsely identifying areas within the already identified porosity or identifying any pixel as belonging to two facies groups. This can be achieved through subtraction of one image from another using Process/Image Calculator… The results are shown in Figure 4.
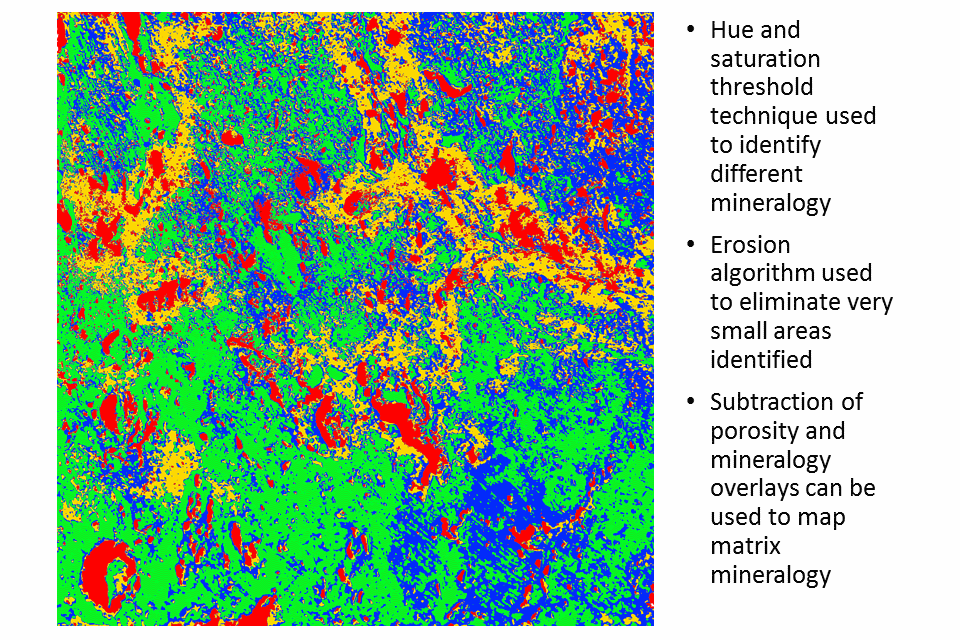
Here we have categorised our original image into four different groups. The red areas represent porosity, with contribution from both the vugs and smaller pores. The green areas are the very light carbonate rock fabric which could be associated with biological matter. The yellow areas are the darker carbonate rock fabric which could be associated with dolotomisation and the blue area is simply what is left over. This is the base carbonate matrix.
The image reveals some interesting features of the reservoir. We can see that areas of dolomitisation tend to lie along linear trends which could represent fluid flow through the reservoir. These fluids have chemically altered the base rock matrix to cause the dolomotisation. Furthermore the fluid flow may have created vugs, and there are more vugs close to the potential fluid flow pathways. Small pore spaces are more prevalent in areas of dolotomisation and away from biological matter. This might be expected because the dolotomisation contributes to the formation of pore space as a result of fluid flow through the reservoir, but the biological matter restricts flow of fluids through the carbonate, so there is less dolomotisation in those areas. Vugs presents in areas of biological matter could be created through larger organisms that have decayed, and are thus different to the vugs in the dolotomised regions which might have resulted from fluid flow.
Whilst the image analysis is a relatively straightfoward technique, it does help us to understand that there is very likely to have been fluid flow in the reservoir, and that therefore there is very likely to be good permeability in the reservoir. This can aid with putting together the diagenetic history for the reservoir. We can also recognise using our image processing the two main types of porosity that are revealed through visual examination of the core.
Porosity Calculation From Binary Mask
Calculation of porosity from a binary image is relatively simple using ImageJ. ImageJ will measure various image statistics when the Analyze/Measure command is run. The statistics to measure can be set from Analyze/Set Measurements… command. For the calculation of porosity we must ensure that the ‘Area’ and ‘Area fraction’ options have been selected.
Once the measurements have been selected calculation of porosity is simple:
- Select the binary image where porosity is identified as black pixels and matrix as white pixels
- Run command Analyze/Measure
- Porosity is shown in the ‘%Area’ column of the Results window that is produced
The calculated porosity using the porosity mask generated from our core photograph is shown in Figure 5. This indicates that porosity for this particular image shown is 10.4 percent.
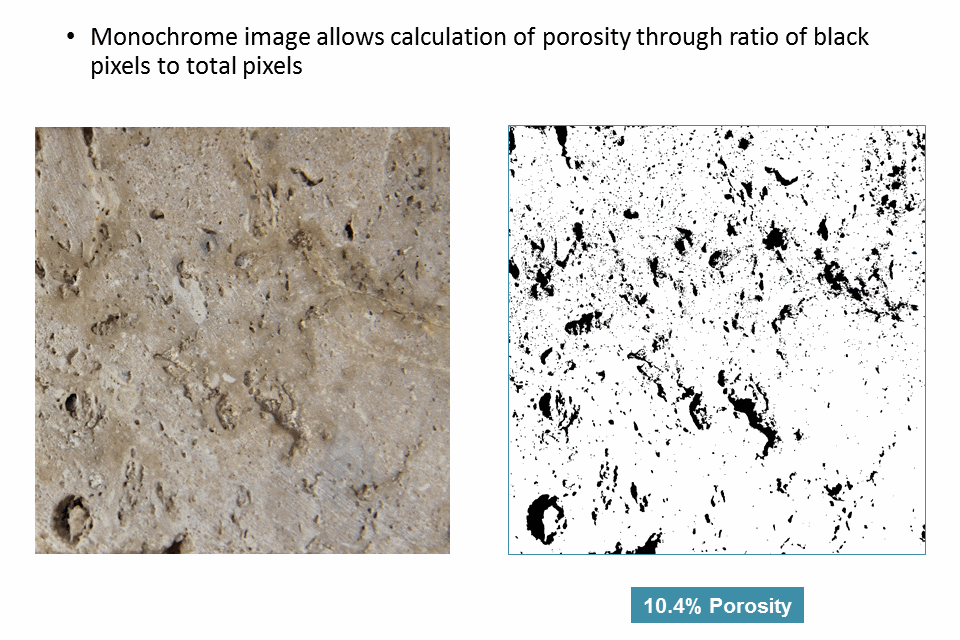
Note that this whilst this technique can quickly produce an indicative measurement for the porosity, it does have some shortcomings:
- Not all porosity is captured by the threshold technique. In particular larger vugs do not produce a dramatic brightness contrast across the entire pore as light can more easily penetrate into the pore space, whereas smaller pores can be easily identified. Similarly areas of darker rock facies can be mistaken for porosity. A visual comparison between the core photograph and the porosity mask suggests that the porosity measured using this technique is likely to be a slight underestimate.
- Only porosity that can be visually identified will be measured using this technique. Thus any microporosity will not be included in the measured porosity.
It may be necessary when calculating porosity to exclude certain parts of the image. This can be achieved by measuring the statistics within the area to be excluded, and then adjusting the statistics for the whole image to account for the difference. This is a straightforward calculation.
- Draw an area on the binary image that is to be excluded
- Run command Analyze/Measure
- Results window should now show an additional row which includes statistics for the excluded area only
- Adjust porosity calculation using the equation
((img_area * img_area_pct) - (excl_area * excl_area_pct)) / (img_area - excl_area)
Understanding Porosity Distribution
The previous core photograph shows a visual porosity measurement of 10.4 percent. Is this comparable to log or core measured porosity?
Generally carbonate is not homogeneous, and some sections of core (where recovered) can exhibit more prevalent vugginess. An example of this is shown in Figure 6. This core photograph has been analysed using the excluded area technique because part of the core was removed to take a core plug. Records indicate that the laboratory measured porosity for the core plug was just 7.8 percent. Reliance on this core porosity without examination of the core might lead to a belief that the carbonate has poor porosity development. Yet it can clearly be seen that there are extensive large vugs in the core.
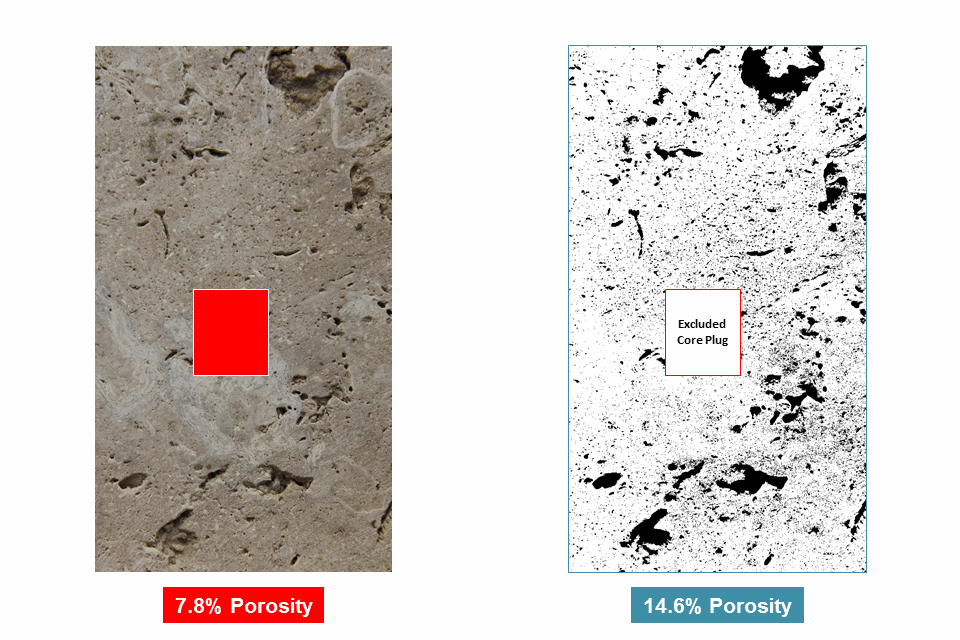
The visual porosity estimate for the whole core image, excluding the core plug area, is 14.6 percent. This is nearly twice as high as the core measured porosity. Does this mean that the core measured porosity or the visual porosity estimate is wrong? Not at all. Any core plug is very likely to be taken from a section of the core that is competent and can from which porosity can easily be measured using laboratory techniques. The intent would therefore be to avoid taking a core plug through the vuggiest part of the core. As such the core plug is only measuring part of the porosity.
In order to understand this more clearly, we can look at the porosity distribution. By taking our binary mask for porosity, we can filter the image based on the areas of discrete features. In Figure 7 we have assigned features into five different area bins: 0-49 pixels, 50-99 pixels, 100-149 pixels, 150-199 pixels and 200+ pixels.
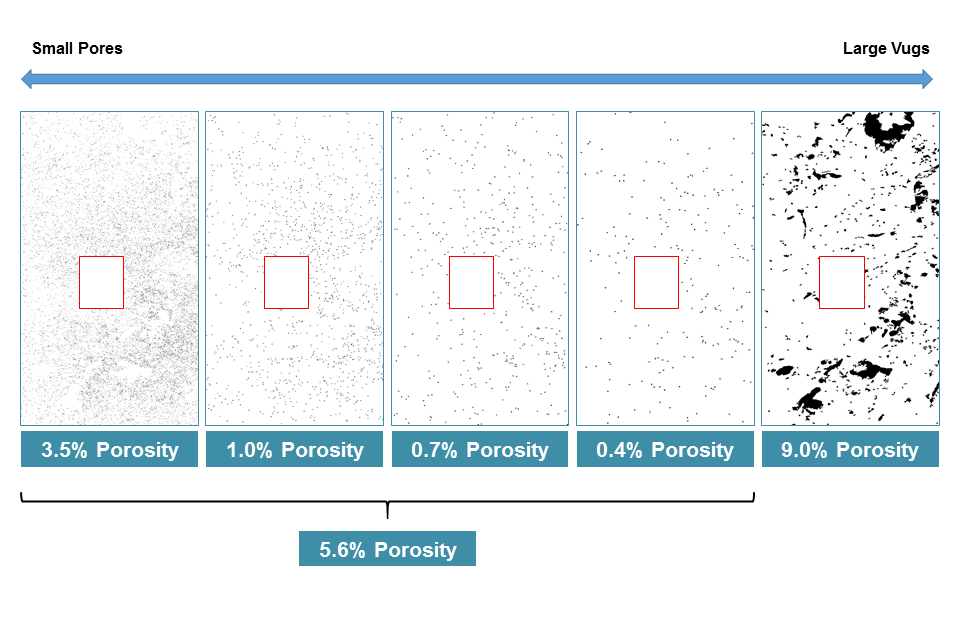
This porosity calculated for each bin image helps to understand the nature of the porosity distribution in the carbonate reservoir.
- There is more porosity contribution from very small pores than from medium sized pores. The overall porosity from small to medium size pores is 5.6 percent, which is in line with the core plug measured porosity of 7.8 percent.
- Over half of the porosity is associated with larger pores and vugs.
This reveals that porosity in carbonates is not a straightforward property to characterise, and there is evidence that the average porosity in a carbonate reservoir may be higher than that indicated from wireline log and core measurements alone. Where data indicates poor core recovery, drilling breaks and loss of circulation during drilling, these are signs that are consistent with a porosity model that also includes some porosity contribution from very large dissolution features.
Conclusions
A visual technique has been used to estimate porosity from a core photograph. The technique combines digital photographs of the core surface with image processing algorithms to calculate the porosity. The technique is also able to distinguish between different types of porosity, and the relative contribution from each.
The technique is non-destructive, cheap and fast. By examining the original core and using this simple first principles approach, a case can be made to support the use of more sophisticated techniques to image the core porosity in three dimensions. Doing so will help to understand the geological processes that were present post-deposition, and help understand the upside potential for porosity in a field.
