
Several years ago in 2009 as the financial crisis was gripping the world, and the oil price had plummeted rapidly from a high of over $147/bbl, I gave a talk to SPE Singapore looking at what was driving the movement in oil price, and my thoughts for where it might be heading. Today we are facing a similar situation where the oil price has declined dramatically, and it is at times such as this that fear stokes market sentiment. We are now hearing from the expert pundits that oil will never again return to more than $100/bbl, and that we should prepare for $20/bbl in the long run.
Really? Perhaps it is the cynic in me, but I joined the oil industry in 1999, the scene of yet another of the oil industry’s flirtations with a bust driven by a collapse in oil prices, and in that year none other than the highly respectable The Economist published the now infamous issue entitled “Drowning in Oil”. Needless to say any predictions of sustained oil prices below $10/bbl were not borne out by history.
Back in 2009 my analysis of the available data, and a steadfast refusal to listen to the perceived wisdom of the crowd, led me to conclude that it was very unlikely that oil prices would remain “lower for longer”, and that it was inevitable that they would soon rebound to much higher levels. What led me to this conclusion, and what specific aspects underpinned my confidence? Call me old-fashioned, but I’ve always stuck by the view that oil price is controlled by the fundamentals of supply and demand. It is plainly obvious that this should matter, and that all other things being equal, in a perfect market free from distortions this would be the sole barometer that sets the price. Yet the oil market is not perfect, and is subject to cartel behaviour (OPEC), alleged market manipulation (futures trading) and geopolitics (take your pick…) amongst other distortions. So when I originally addressed SPE Singapore in 2009, it was against this backdrop of an irrelevancy concerning supply and demand that I delivered my predictions.
Supply and Demand Oil Price Balance
There are many opinions as to what drives the oil price, and whenever there are extreme movements in the price the pundits have a field day. Some of these appear politically agreeable on the surface, such as the backlash against traders during the market peak in 2008 where speculation was blamed for driving up prices (and thus by implication the financial industry is to blame for high petrol prices). Boo! However even a cursory analysis of the data quickly reveals that there is no correlation between the net positions of traders and oil price movements, but debunking that myth almost certainly will gain close to zero attention.
My own take on the supply and demand balance for the world’s oil market was not a simplistic comparison of total oil supply versus total oil demand. In itself this will not reveal a great deal. Take the BP Statistical Review of World Energy 2015 for example. A cursory glance at total world oil production versus consumption reveals production of 88.67 million barrels per day, but consumption of 92.09 million barrels per day. That’s quite a deficit.
So rather than just look at a comparison between the absolute daily production and consumption of liquid hydrocarbons, I took a different approach. What is the most expensive barrel that would theoretically be required to meet current consumption. Today oil is produced from a myriad of sources, all of which have wildly differing development costs, most of which are higher than what might otherwise be publicly claimed. Even so it’s clear that the cost of production for onshore light sweet crude is going to be cheaper than producing heavy oil offshore. So all that’s needed is to break down world oil production into the different sources of supply, and compare against the raw demand for liquid hydrocarbon products.
Most of the publicly available information on world oil production and consumption is compiled from country-level data, and as such is available grouped into countries and regions. Therefore an attempt has been made to regroup the public information into sources of oil production, through use of common sense and other supporting data sources.
Recategorising Supply Into Production Sources
Before splitting our sources of supply into different categories, we must first define those categories. Since we are interested in identifying what the most expensive barrel required to meet raw demand is, we can focus our attention on the more expensive sources of production, and live with any inaccuracies in the cheaper sources. It should be noted that the re-categorisation performed here is almost certainly not completely accurate, but the important part is that it helps to reveal what the underlying story behind oil price movements might be.
From cheapest to most expensive (subjective) sources of liquid hydrocarbons, the categorisations used are:
- OPEC Middle East: It is widely recognised (speculated?) that the large oil fields in the Middle East have the lowest costs of production in the world. Clearly there are a range of production costs between countries and fields, but the region includes many of the discovered giant and super-giant fields in the world. Thus this is a sensible foundation category for the sources of world production. Data is obtained from EIA and BP Statistical Review of World Energy for Iran, Iraq, Kuwait, Qatar, Saudi Arabia and the United Arab Emirates.
- Spare Capacity: Not all wells drilled and completed in the Middle East are immediately placed on production. However as these fields have been developed, the source is included as a potential contributor to supply. The data is obtained from estimates by EIA.
- Conventional Onshore: This should include all onshore field development. In reality it is probably the category subject to the highest level of uncertainty, since this category is simply the difference between total global production and all other sources of production.
- Offshore Production: Offshore production has been estimated by looking at the production from eight major offshore producing areas. These are Angola, Australia, Brazil, Malaysia, Mexico, North Sea (UK, Norway, Denmark), Vietnam and the Gulf of Mexico. There are definitely other areas worthy of inclusion such as Thailand, Gabon, Equatorial Guinea etc. It is recognised therefore that this is probably an underestimate. Nonetheless estimates of production from these countries or regions are used as a proxy for the shallow offshore contribution by non-OPEC countries. Since marine infrastructure is more costly than onshore infrastructure, the cost per barrel for offshore development is shown as more expensive than conventional onshore development. Data is from BP, supplemented by data from Petrobras and the US Minerals Management Service.
- Natural Gas Liquids: Production of condensate obtained from natural gas constitutes a sizeable contribution to overall world liquid hydrocarbon supply. Natural gas developments typically require the additional cost of pipelines to deliver gas to market, or LNG plants, so an assumption has been made that on average NGL production is more expensive than conventional onshore or offshore production. Data is from estimates by EIA.
- US Shale Oil: The poster child for the resurgence of the US oil industry. Fracking of horizontal wells drilled into shale formations has unlocked unconventional supplies of crude and has rapidly reversed what was a decades long decline in conventional oil production. However the process is drilling intensive, with wells that decline rapidly. As such production costs are high, and with the sweet spots drilled first in any play, any gains in the capital costs for development and well productivity are counteracted by a reduction in the quality of the shale being chased. Nonetheless, whilst this is recognised as a higher cost source of oil, it is not the most expensive source around. Data is from estimates by EIA.
- Heavy Oil: Heavy oil, so-called because of its higher density relative to water, typically has a low viscosity meaning it will not flow as easily from a reservoir without assistance. Techniques that have been proven to work generally involve the injection of steam in some form into the reservoir, the generation of which requires both water and energy. Thus this tends to be an expensive source of oil. There are three large areas of heavy oil production: California, Canada and Venezuela. Estimates for heavy oil production from some of these regions are based on data from Canadian Association of Petroleum Producers and California’s Division of Oil, Gas & Geothermal Resources. Other estimates are based on news articles.
- Deepwater: Until US Shale Oil, deepwater was the fastest growing source of additional oil. As the industry has pushed into ever deeper depths, and developed the subsea and floater technology necessary to produce from these fields, whole new regions of resource have been opened up. However the costs can be staggering, meaning development of these resources is left to national oil companies, majors and large independents. To discern deepwater production, certain regions have been examined e.g. Gulf of Mexico, Brazil, Angola and other West African countries. Data from BP, Petrobras and Douglas Westwood have been used to estimate total deepwater production, and to discern this from conventional offshore production in countries that have both shallow water and deepwater production.
- Oil Sands: Undoubtedly the most expensive source of oil available in the world today, production of oil from the oil sands of Canada is (with some techniques) more akin to mining than actual drilling. CAPP data is used to separate production in Canada into oil sands, heavy oil and conventional production.
Of these sources, we can generally group heavy oil, shale oil, deepwater and oil sands into an “expensive sources” group. Whilst there is of course massive variation in the breakeven development cost for these sources, the more efficient developments start at around US$50/bbl, and rise for some deepwater developments to more than $80/bbl. It is generally accepted that at sustained oil prices below $30/bbl, none of these sources of oil would remain economic with respect to new field developments.
What About Demand?
For the demand side of the equation we do not need to split into different categories, but we do need to make an adjustment for refinery gain. This is the additional volume of liquid hydrocarbons that appears as a result of refining of crude oil, and typically oil consumption is not measuring the actual consumption of crude oil by refineries, but the consumption of refined products by country. Thus to estimate the raw demand for crude oil itself, we much deduct any refinery gain from world oil consumption. Data for oil consumption is obtained from BP Statistical Review of World Energy, and the estimates of refinery gain are taken from EIA.
Putting It All Together
After crunching the numbers it is time to make a pretty graph. We simply overplot raw demand over the available sources of supply, with supply ordered from the cheapest through to the most expensive sources.
What we see is that there are definitely pinch points in the system, where demand and supply were stretched, and periods where there was ample supply to meet demand. What is interesting is that the pinch points tend to correlate with periods of high oil price, which confirms a view that supply and demand has an influence on the oil price.
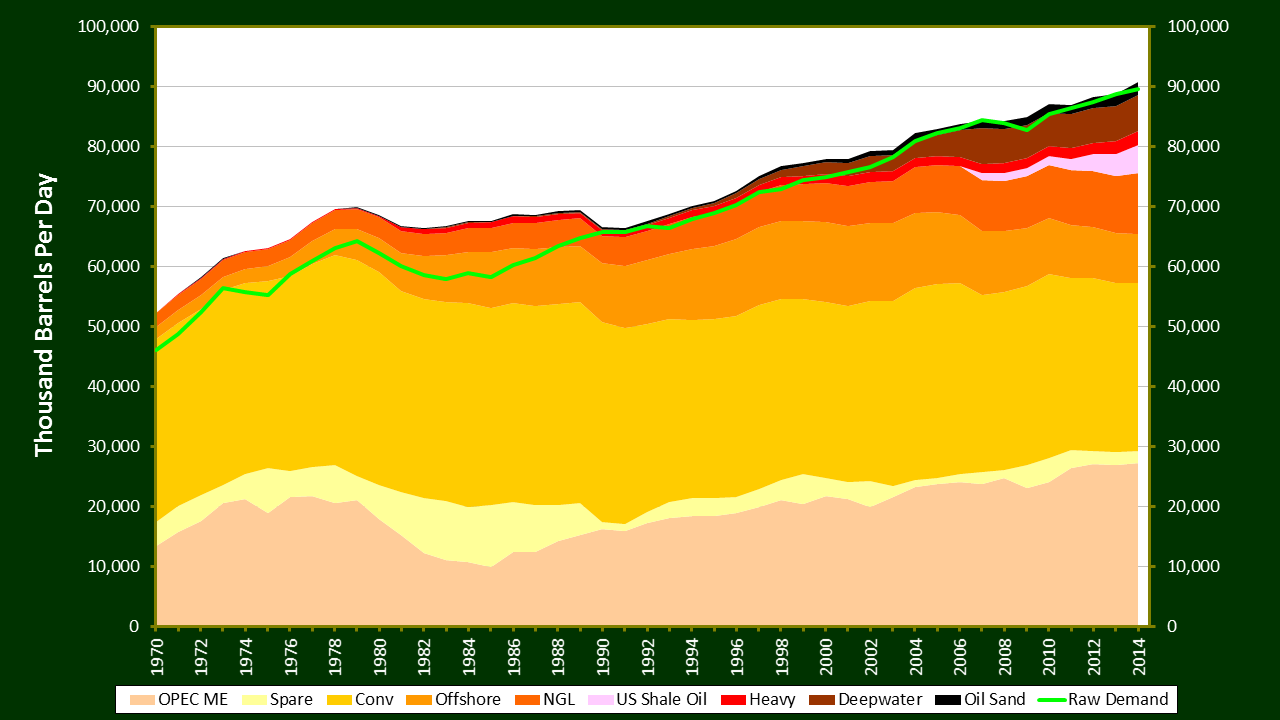
Source: Peter Kirkham based on public information from EIA, BP and other regional authorities.
What Does It Mean?
There are several observations that can immediately be drawn from casual inspection of this graph. Firstly, it does a remarkably good job of providing a narrative explanation to large movements in the oil price. This lends credence to the hypothesis that supply and demand matter when it comes to determination of the oil price.
Let’s examine some of the more pertinent features more closely:
- Arab Oil Embargo and Iranian Revolution: The oil shocks of 1973 and 1979 both appear to be associated with periods in which the marginal cost of production was moving from conventional onshore production to offshore production. Had the available supply from cheaper sources of oil been higher, then perhaps the political events of the time could have been less influential on the oil price? In any event we know that oil prices spiked rapidly in response to these events, and the consequential drop in raw demand is clear. Between 1973 and 1986 demand barely grew and remained at a level between 50 to 60 million barrels per day. This drop in demand has not been seen again since the early 1980s.
- Iraqi Invasion of Kuwait: In the early 1990s Iraq invaded Kuwait provoking a response from the United States. This led to a drop in available supply from the Middle East region, despite the utilisation of nearly all spare capacity at the time. Again the combination of a geopolitical event and the movement of the marginal cost during the 1990s, world oil supply was just about able to keep pace with growing demand thus avoiding increases to the oil price.
- ‘OPEC Discipline’ post-2000: In the aftermath of the Asian financial crisis, oil prices plunged in 1999, leading OPEC to declare a new-found discipline and adherence to quotas. This is often cited as the reason for the steady increase in oil price from 2000 onwards. However an examination of the marginal source of supply suggests a different explanation may also have been involved. From about 2000 onwards, the marginal barrel could no longer be met from cheaper sources of oil, and the industry responded to increased demand with growth in more expensive sources of oil, particularly from deepwater sources, and latterly from shale oil. Where OPEC was successful during this period is in maintaining sufficient discipline to maintain balance in the oil market, avoiding over-investment which might have led to a glut of oil. As a result oil prices remained high and there were few crises due to sudden drops in the oil price.
- Global Financial Crisis: The financial crisis in 2008 illustrates the role that a drop in demand has to play. Whilst the drop in demand was not great, nor sustained, it was sufficient to precipitate a large fall in oil price. The drop in demand was faster than could be accommodated by any OPEC discipline, and thus stability in the oil price was temporarily lost.
- Increased Reliance on Expensive Sources of Oil: At the time of the global financial crisis it was apparent that in the absence of a complete collapse in oil demand, it was inevitable that oil prices would rise again following any recovery in demand. This is simply a reflection of the increased contribution to world supply from more expensive sources of supply. By 2014 approximately 15 million barrels per day was being delivered from expensive sources. Another remarkable correlation is that from 2003 onwards, the point at which it is recognised the oil industry’s hot market started to get underway, the marginal barrel would be found in oil sands production. Is it any wonder the oil price rose to more than $100/bbl?
- Relentless Growth in Raw Liquids Demand: There has not been a sustained drop in oil demand since the early 1980s. This is despite oil prices in excess of $100/bbl. Improvements in energy efficiency, and increases to global GDP, mean that the influence of high oil prices on consumer behaviour has become increasingly diminished over time. Instead we see a trend of increased oil consumption per capita overlaid on the underlying global population growth. This is a trend that is likely to continue into the future, as the scope for growth in oil demand in emerging economies outweighs any potential savings from the developed world as a result of conservation efforts.
Where To Next?
Whilst the technique presented appears powerful, any forecast on where prices might be heading is subject to assumptions made on future supply and demand. In the current market this is by no means certain. However we can look towards a short term forecast of supply and demand produced by the EIA known as the short term economic outlook (STEO).
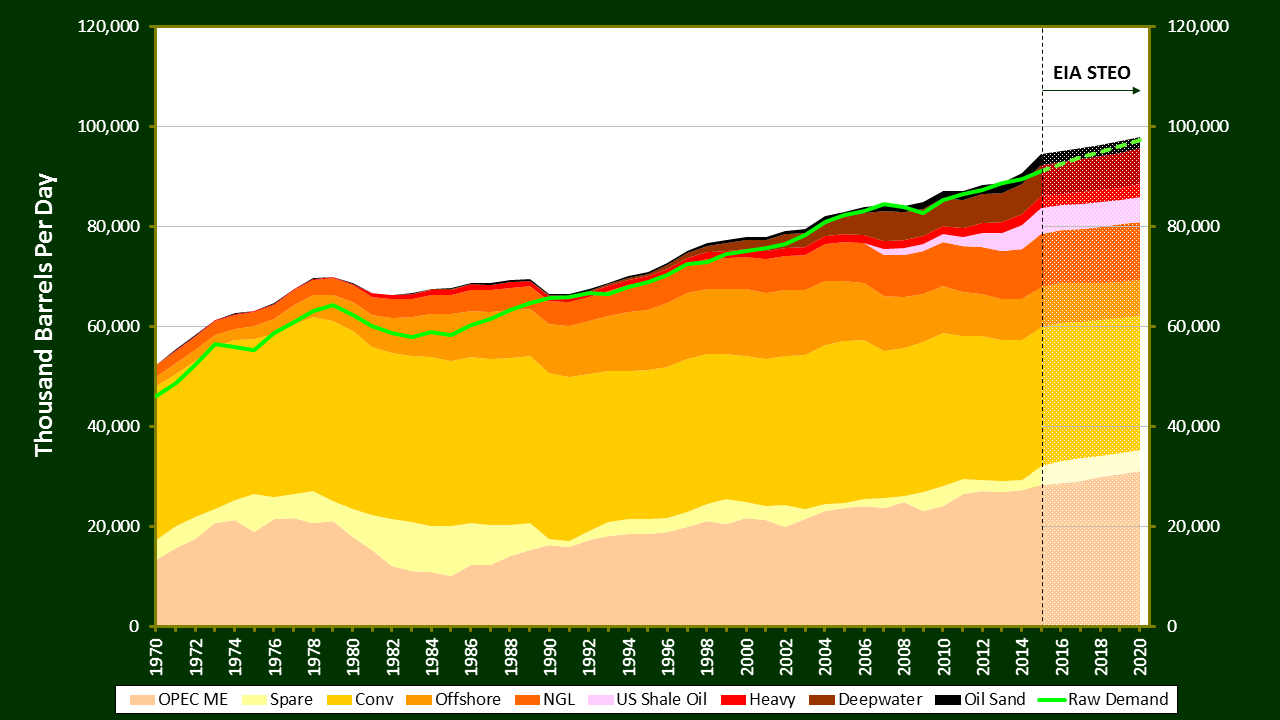
Source: Peter Kirkham based on public information from EIA, BP and other regional authorities. Short term economic outlook (STEO) by EIA.
Using this data it appears once again inevitable that oil demand will continue to rise to a level whereby the marginal barrel of supply is once again drawn from the most expensive source. The forecast suggests that this may not occur until 2017 or 2018 at the earliest. However the response of oil supply to market prices does not appear to have been fully factored into the current supply forecasts. In particular it is known that shale oil production can not only ramp up quickly in response to price, but any drop in sustained drilling means that production will also rapidly decline. Thus this forecast may present too optimistic an outlook for global oil supply.
I believe that what has changed in the market is that with the unprecedented responsiveness of US shale oil to market pricing signals, it is simply a losing battle for any other producers to attempt to maintain stability of high prices in the oil market. So forget any pacts between Russia and Saudi Arabia – it’s just bluster. Sustained high prices would only spur further investment in shale oil, thus necessitating further cuts to conventional production by the colluders in order to maintain high prices. A vicious circle. Instead the logical conclusion must be that in response to the nature of this new source of oil, it is finally time to let the market determine the price of the marginal barrel. I believe that this is what Saudi Arabia is now doing. The facade of any battle between OPEC and US shale oil producers is just that – a fantasy invented by the media to spin a story for gullible investors. I can understnad why. The truth is far more boring.
In the short term this means that there will be glut of oil as spare capacity is unleashed onto the market, thus increasing inventories. It will take time for growth in shale oil production to decline, ultimately slowing the growth in oil production, and thus bring supply and demand back into closer balance. In response it is reasonable to anticipate that the oil price will rise again, until a price is reached at which growth in shale oil production matches growth in oil demand. I predict that shale oil is here to stay, and in time will provide a support to the oil price at around the $50/bbl level in the long term.
Finally, given the inexorable growth in raw demand, I believe it is only a matter of time before we see $100/bbl again. As Warren Buffett says, “be greedy when others are fearful”. Now is the time to be investing into the future of the oil industry. Prices will recover.